Download
1 / 1

E N D
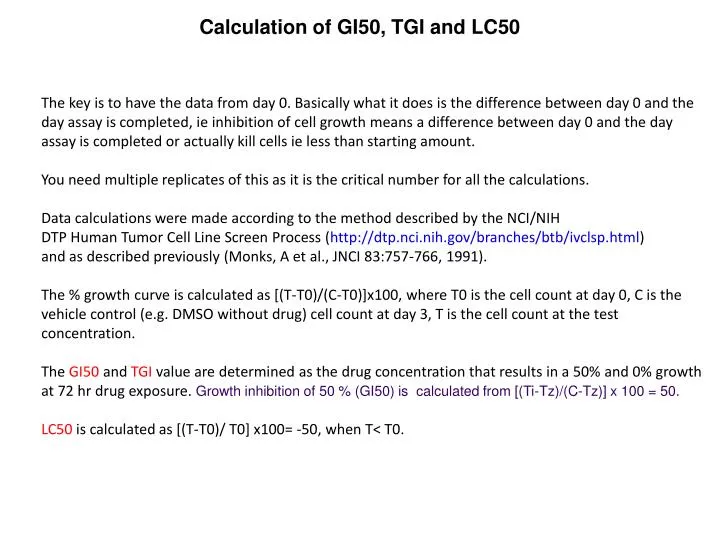
Calculation of GI50, TGI and LC50 The key is to have the data from day 0. Basically what it does is the difference between day 0 and the day assay is completed, ie inhibition of cell growth means a difference between day 0 and the day assay is completed or actually kill cells ie less than starting amount. You need multiple replicates of this as it is the critical number for all the calculations. Data calculations were made according to the method described by the NCI/NIH DTP Human Tumor Cell Line Screen Process (http://dtp.nci.nih.gov/branches/btb/ivclsp.html) and as described previously (Monks, A et al., JNCI 83:757-766, 1991). The % growth curve is calculated as [(T-T0)/(C-T0)]x100, where T0 is the cell count at day 0, C is the vehicle control (e.g. DMSO without drug) cell count at day 3, T is the cell count at the test concentration. The GI50 and TGI value are determined as the drug concentration that results in a 50% and 0% growth at 72 hr drug exposure. Growth inhibition of 50 % (GI50) is calculated from [(Ti-Tz)/(C-Tz)] x 100 = 50. LC50 is calculated as [(T-T0)/ T0] x100= -50, when T< T0.