Download
1 / 18
180 likes | 275 Views

E N D
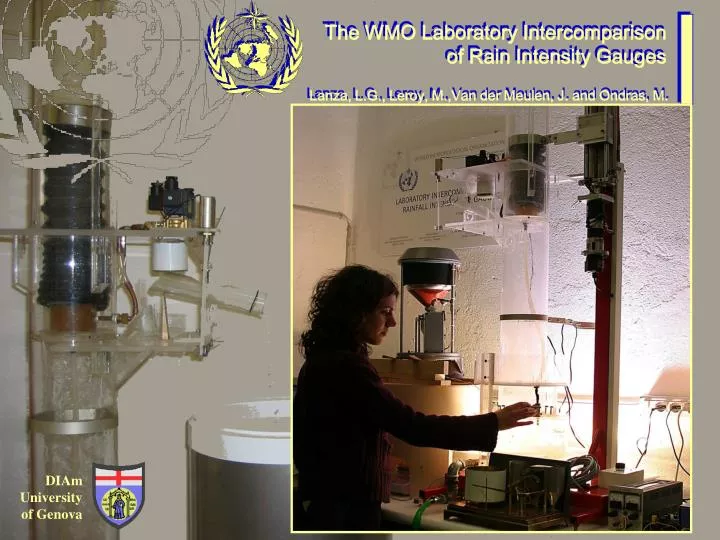
The Joint Expert Team on Surface-Based Instrument Intercomparison and Calibration Methods (ET on SBII&CM) and International Organizing Committee (IOC) on Surface-Based Instrument Intercomparison, according to the CIMO Plan of WMO intercomparisons, started in September 2004 the WMO Laboratory Intercomparison of Rainfall Intensity (RI) Gauges. The Intercomparison is performed at the recognized laboratories of the Royal Netherlands Meteorological Institute (KNMI), the Netherlands, Météo France, France, and the University of Genoa, Italy. DIAM UNIGE Rationale Selection of Instruments Methods and Procedures Preliminary Results Conclusions
The main objective of the intercomparison was to test the performances of catchment type rainfall intensity gauges of different measuring principles under documented conditions. • Further objectives can be summarized as follows: • To define a standardized procedure for laboratory calibration of catchment type rain gauges, including uncertainty of laboratory testing devices within the range from 2 to 2000 mm/h; • To performances of the instruments under test; • To comment on the need to proceed with a field intercomparison of catchment type of rainfall intensity gauges; • To identify and recommend the most suitable method and equipment for reference purposes within the field intercomparison of catching and non-catching types of gauges; • To provide information on different measurement systems relevant to improving the homogeneity of rainfall time series with special consideration given to high rainfall intensities. Rationale Selection of Instruments Methods and Procedures Preliminary Results Conclusions
Only catchment type of instruments that are currently being used in national observing networks or are being considered for use in national networks and are capable of measuring rainfall intensity of at least 200 mm/h at a time resolution of 1 minute were tested. Nineteen(19) types of instruments had been selected, with usually 2 instruments of the same type, produced by 18 different manufacturers. Fifteen countries were represented; out of them 10 from Europe and five non-European countries. Twelve out of the instruments selected are tipping-bucket rain gauges, while 5 are weighting gauges, one is based on conductivity measures and one is based on the measurement of the water level. Rationale Selection of Instruments Methods and Procedures Preliminary Results Conclusions
The Intercomparison was conducted at the recognized laboratories under the supervision of the Site Managers appointed by the host countries. Per each of the instruments involved, each laboratory performed five calibration tests according to the different calibration/testing instruments used and to the experience of the Site Managers. The number of tests performed per each of the instruments, their description and duration (in terms of time units and/or number of tips, etc.) was noted and reported. Environmental parameters were also noted and recorded. The calibration was different according to the type of instrument analyzed, namely its measuring principle. Rationale Selection of Instruments Methods and Procedures Preliminary Results Conclusions
Tipping Bucket The calibration test consists of providing the gauge with a constant water flow, generated by a suitable device, by calculating the average intensity from the measurement of the total amount of water actually provided within a given period of time and by comparing this amount with the average intensity measured by the instrument in the same period . The duration of the test and the mass measurement are controlling factors for determining the accuracy of the calibration. A mass and a duration used for each test must be chosen so that the uncertainty of the reference intensity is less than 1%, taking also into account the resolution of the instrument. These masses and durations have been noted and reported, together with the number of tips involved in each test. Constant flow rate Water source Water collector Rain gauge Fixed head or pump Weighting device Weighting device Computer control Rationale Selection of Instruments Methods and Procedures Preliminary Results Conclusions
Tipping Bucket • Each calibration was performed at least at seven reference flow rates with the following rules : • Seven reference intensities are fixed at 2, 20, 50, 90, 130, 170, 200 mm/h; • If the maximum declared intensity is less or equal to 500 mm·h-1, further reference intensities are determined at 300 and 500 mm·h-1. • Otherwise, three further reference intensities are determined within the remaining range of operation of the instruments by dividing it logarithmically from 200 mm·h-1 up to the maximum declared intensity. • The reference intensity has been obtained within the following limits: • 1.5 – 4 mm·h-1 at 2 mm·h-1 • 15 – 25 mm·h-1 at 20 mm·h-1 • and within a limit of 10% at higher intensities. Rationale Selection of Instruments Methods and Procedures Preliminary Results Conclusions
Weighting gauges In addition to measurements based on constant flow rates, the step response of each instrument was checked based on the devices developed by each laboratory. The step response of the weighing gauges was measured by switching between two different constant flows, namely from 0 mm·h-1 to 200 mm·h-1 and back to 0 mm·h-1. The constant flow was applied until the output signal of the weighing rain gauge was stabilized. The time resolution of the measurement was higher than 1 minute, e.g. 10 seconds, and the possible delay was evaluated by determining the first time interval when the measure is stabilized, within a maximum period of 10 minutes. Attention was paid in particular to assess the effects of vibrations and to reduce them in order that their impact on the measurement is < 1%. Iref = 96.6 mm/h Rationale Selection of Instruments Methods and Procedures Preliminary Results Conclusions
Other measuring principles • In addition to measurements based on constant flow rates, the step response of each instrument was tested based on the devices developed by each laboratory. • Full description of the method and instruments adopted in each specific case is provided by every Site Manager. • Attention was paid in particular to assess the effects of the following potential error sources: • conductivity measure • time between the water falls in the gauge and the level is adapted • water level not stabilized • water retention in the funnel and in the pipes • etc. Rationale Selection of Instruments Methods and Procedures Preliminary Results Conclusions
Presentation of the results • The results are presented in the form of an average error curve that is derived as follows: • The error is evaluated per each reference flow rate as: • where Im is the intensity measured by the instrument and Ir the actual reference intensity provided to the instrument; • Five calibration tests are performed per each set of reference intensities, so that five error curves are associated with each instrument; • An average error curve is obtained by discarding the minimum and maximum error value obtained per each reference flow rate, then evaluating the arithmetic mean of the three remaining error and reference values, and finally fitting these average values within the range of reference intensities with a second order polynomial as below: • with a, b and c suitable numeric coefficients; Rationale Selection of Instruments Methods and Procedures Preliminary Results Conclusions
Presentation of the results An alternative way of presenting the results is by expressing the actual intensity as a function of the measured intensity, which usually yields a power law in the form: where a and b are two suitable parameters. In the table below the values of a and b are reported for some of the tipping-bucket rain gauges tested at the laboratory of DIAM in a previous project. From: La Barbera, P., L.G. Lanza and L. Stagi (2002). Influence of systematic mechanical errors of tipping-bucket rain gauges on the statistics of rainfall extremes. Water Sci. Techn., 45(2), 1-9. Rationale Selection of Instruments Methods and Procedures Preliminary Results Conclusions
Example of an average and interpolated error curve obtained at the laboratory of DIAM for a tipping bucket rain gauge.
Example of an average and interpolated error curve obtained at the laboratory of KNMI for a tipping bucket rain gauge.
Example of an average and interpolated error curve obtained at the laboratory of Météo France for a tipping bucket rain gauge.
Conclusions The WMO Laboratory Intercomparison of Rain Intensity (RI) Gauges is currently in progress, with the laboratory tests on the 19 instruments involved to be completed before Summer 2005. A glance on the methodologies used at all three laboratories in charge of the intercomparison at Météo France (France), KNMI (The Netherlands) and the University of Genoa (Italy) has been provided in this paper, together with some preliminary results on the tests already performed. The wide response obtained in the launching phase of the intercomparison, the large number of instruments proposed and the spreading of such instruments among various measurement principles and techniques is very promising and the final results of the intercomparison will be certainly of interest for both the meteorological and the hydrological communities. Rationale Selection of Instruments Methods and Procedures Preliminary Results Conclusions
Conclusions From the initial data obtained in all three laboratories, we can say that – as expected – tipping bucket rain gauges that do apply correction for systematic mechanical errors by means of some post-processing technique dramatically reduce the errors and seems to accommodate for the [-5%, 5%] relative error requirements, while non-corrected gauges show much larger errors while progressively increasing the reference rain rates (up to 20% at the highest intensities). As for the weighting gauges, the main problem seems to be the step response, though additional data are needed before conclusions can be drawn. Call for papers EGU General Assembly – Vienna, April 2-7 2006 http://www.copernicus.org/EGU “The WMO Laboratory Intercomparison of Rainfall Intensity Gauges” Conveners: Luca G. Lanza, Michel Leroy, Jitze Van der Meulen Rationale Selection of Instruments Methods and Procedures Preliminary Results Conclusions
Thank you for your attention