Download
1 / 59
600 likes | 625 Views
Using the THEMIS energetic Particle Data. Davin Larson Space Science Lab; Berkeley Thomas Moreau. THEMIS Mission. 5 identical spacecraft in highly elliptical orbits (1,2 &4 day periods) Each spacecraft has 5 instruments: FGM – Flux Gate Magnetometer SCM – Search Coil Magnetometer

E N D
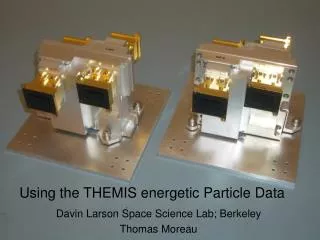
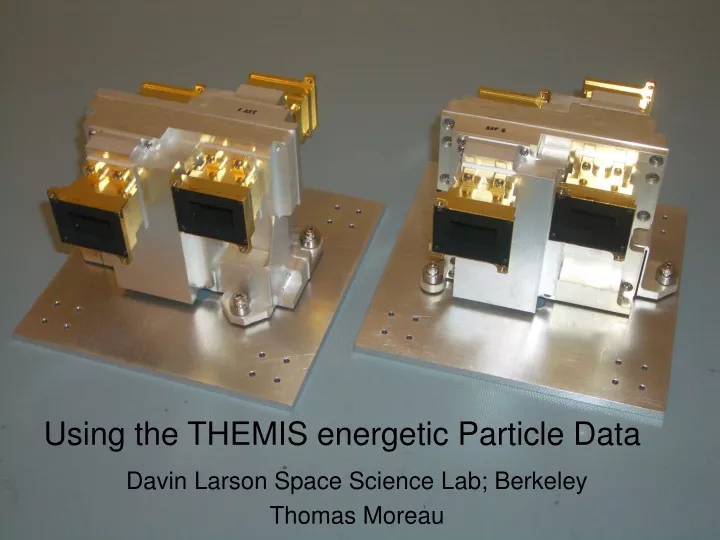
Using the THEMIS energetic Particle Data Davin Larson Space Science Lab; Berkeley Thomas Moreau
THEMIS Mission • 5 identical spacecraft in highly elliptical orbits (1,2 &4 day periods) • Each spacecraft has 5 instruments: • FGM – Flux Gate Magnetometer • SCM – Search Coil Magnetometer • EFI - Electric Field Instrument (DC and AC) • ESA - Electrostatic Analyzer • SST - Solid State Telescope
SST Science Objectives • Primary- • Measures upper end of particle distributions to determine complete moments. • Identification of Current Boundaries • Secondary • Radiation Belt Science (source populations) • Understanding dynamics of MeV electron flux. • Determine source of heating • “Instantaneous” measurement of radial profile of energetic particle fluxes. • The SST was not designed to measure particles in the Radiation Belt environment – Only survive it!
SST Instrument Description Summary • Solid State Telescopes: • Measure Energetic Electrons and Ions • Energy Range: • H+: 25 keV to 6 MeV • Electrons 25 keV to ~900 keV • Angular Coverage: • Theta • 4 look directions (+55, +25, -25, -55) • Resolution: ~ 30 deg FWHM • Phi • 32 sectors • Resolution: ~20 deg FWHM • Geometric Factor: ~0.1 cm2-ster (~1/3 of WIND) • Mechanical Pinhole Attenuator: Lowers geometric factor by ~64
SST Principle of Operation Electron Side Ion Side Foil Detector Al/Polyamide/Al Foil (4150 Ang thick –stops Protons < 350 keV) Thick Detector Open Detector electrons ions ions electrons Foil Collimator Open Collimator Attenuator Attenuator Sm-Co Magnet ~1kG reflect electrons <350 keV
Foil Collimator Attenuator Foil Detector Stack Magnet Attenuator Open Collimator Foil Side (electrons) Open Side (ions) Open Collimator Attenuator Magnet Detector Stack Foil Attenuator Open Side (ions) Foil Collimator Foil Side (electrons)
Types of detector events • With a stack of 3 detectors there are 7 types of coincident events: • F - Single event in Foil detector (electrons <350 keV, ions >350 keV) • O - Single event in Open detector (protons <350 keV, electrons > 350 keV) • T - Single event in Thick detector (xrays, scattered electrons) • FT – Double event in Foil & Thick (electrons 350 -600 keV • OT – Double event in Open & Thick (Ions > 6 MeV) • FTO – Triplet event – (electrons < 1MeV, protons >10 MeV) • FO - Treated as separate F and O events. • Of the 16 energy channels the first 12 are devoted to singlet events. The last 4 channel record multiples.
SST Mechanical Design • DFE Board Subassembly BeCu Gasket (3) Detectors (4) KaptonHeater Spring Clamp PEEK Spacer (4) Spring Plate (2) Kapton Flex-Circuit (4) AMPTEK Shield Thermostat • Detector Board Composition (exploded view)
SST Mechanical Design • DFE Board Subassembly Relative Positions • (2 per sensor) Detector Stack Subassembly Foil Frame Multi-Layer Circuit Board (62 mil thickness) AMPTEK Shielding Thermostat
SST Mechanical Design • Magnet-Yoke Assembly Co-Fe Yoke (2) Sm-Co Magnet (4) (currently not visible) Aluminum Magnet Cage
SST Mechanical Design • Attenuator Assembly SMA Lever (2) Attenuator (4) Cam (2)
SST Mechanical Design • Actuators and Position Switches Honeywell SPDT Hermetically Sealed Switch (2) SMA Actuator (2)
SST Mechanical Design • Support Structure • (front section) Rigid Mounting Flange Kinematic Flexure (2)
SST Mechanical Design A-Open (ion) B-Foil (electron) • Bi-Directional Fields-of-View A-Foil (electron) B-Open (ion)
SST Mechanical Design • Sensor Orientation Relative to Spacecraft Bus SST-1 SST-2
SST Mechanical Design • Attenuator Actuation – CLOSED position Honeywell Switch (compressed-position) Honeywell Switch (extended-position) SMA Actuator (retracted) SMA Actuator (extended)
SST Mechanical Design • Attenuator Actuation – OPEN position Honeywell Switch (extended-position) Honeywell Switch (compressed-position) SMA Actuator (extended) SMA Actuator (retracted)
SST Sensor Mass Summary: Sensor mass= 553.5 gm Cable mass (173 cm) = 141 gm Total x2= 1389 gm Very little shielding from penetrating particles!
Telescope Response • Monte-Carlo simulation • 3D ray tracings are performed: a clean electron-proton separation is obtained • Particles’ angular distributions are determined ( 27 14 FWHM) • Efficiency plots of the electron-proton detectors are determined for different energies
F T O Detector System • Detectors stacked in “Triplet” sequence: • Foil (F) | Thick (T) | Open (O) • Area used 1.32 0.7 cm2 • Front detectors F and O are 300 m thick while T is 600 m (with two detectors back to back) • Detectors associated with a system of coincidence/anticoincidence logic
Instrument Configuration • Instrument Configuration • The SST Energy bins are controlled by DAP table. • Can be reconfigured with table upload. • Precision: 6 MeV/4096 = 1.5 keV • Default configuration is ~log spaced • Only 1 mode currently defined. • The SST 3D (angular) distributions are binned by ETC angle map. • 5 angle maps defined: • 1 angle (omni) • 6 angle (RDF) • 32 angle • 64 angle (burst, FDF) • 128 angle (LEO, testing)
ETC Board • The ETC Board • Interfaces with both ESA and SST • Collects Data • Calculates Moments • Accumulates Distributions • Transfers Data to the IDPU SSR • Produces 4 Data Products: • Moments (spacecraft potential corrected) • Density • Flux • Momentum Flux Tensor, • Energy Flux Tensor • Full Distributions • Reduced Distributions • Burst Distributions (1 spin resolution)
ETC Board • ETC Board Functionality • Table Controlled • Moment Weighting Factors. • Energy Maps • Angle Maps • IDPU loads ETC ROM on mode change boundaries. • Purpose: • Reduces the data rate by combining neighboring angle/energy bins. • Calculated moments can be used for burst triggering.
SST Calibration • Prelaunch calibration of Electron sensors. • Prelaunch electron energy calibration consisted of detector response to low energy mono-energetic electron beam with unknown absolute particle flux. • Electron beam energy varied in 1 keV steps from 15 keV to Emax. • Every attempt was made to keep electron beam flux constant with energy. • Max electron energy was typically limited to ~40-44 keV due to unexpected discharges within the electron gun at higher voltages. • Prelaunch geometric factor was determined by calculation based on collimator acceptance angle and active detector area. • The geometric factor had been assumed to be independent of energy. • Prelaunch calibration of ion sensors • Prelaunch ion calibration consisted of detector response to mono-energetic protons and oxygen with unknown absolute (or relative) particle flux. • Max energy at SSL Calibration facility was 50 keV (~45 keV on low humidity days). Absolute Flux was unknown and varied in an unknown way with energy. • Calibration of 1 ½ sensors performed at APL (many thanks to Stefano Levi and George Ho) allowed response to be measured up to 170 keV for both oxygen and protons.
SST Post Launch Calibration • Post flight calibration issues: • Slow realization (and acceptance) that sensors have significant energy dependent geometric factor correction at low energy. • Degradation in energy response due to radiation damage. This takes on to two forms: • Low energy ions that implant in the first few thousand Angstroms tend to increase the dead layer and result in a shift in energy. • High energy (MeV) ions that pass through the bulk of the detector creating dislocations and recombination sites that reduce the resulting charge pulse. This tends to reduce the gain of the detector. • Need to account for low energy tail of energy response that has significant effect as the spectral slope changes (not yet done) • Account for small non linearity in ADC circuit that affects low energy portion of spectrum for both ions and electrons.
Caveats when using SST data • Saturation at high count rates (>20 kHz/channel) • Sun Pulse • Once per spin • Affects all channels • Easily removed if FULL dists are used • Low energy electron geometric factor caused by scattering by foil • Ion detectors – Increasing Dead layer vs time. • Cross Species contamination • Only important when flux of >400 keV particles becomes significant (inner magnetosphere) • Attenuator state (64x) • Closed within inner magnetosphere (<10 Re) • Controlled by count rate in outer MS • We know there is a substantial difference in measured flux as compared with LANL! (~10)
Sunlight Contamination • When an Open detector sees the sun (once per spin) a voltage spike produce “garbage” counts in ALL channels. • On spacecraft B&C some extra bins were incorrectly masked (zeroed) during most of 2008 tail season • Data should be replaced with interpolated data from adjacent bins • See “thm_crib_sst_contamination.pro” for more info Sunlight contaminated data
THEMIS A Radiation Belts – Typical pass slot Attenuator opens Inner Belt Attenuator closes Outer Belt Outer Belt SST Detector saturated SST Ions ESA SST Elec’s ESA Magneto- sheath Magneto- sphere Perigee: 1.2 Re Not corrected for species cross contamination
THEMIS A SST Radiation Belts – Sample Spectra Ions ESA SST Elec’s ESA Penetrating Radiation Background Outer Belt- Beware! Mostly Background Not corrected for species cross contamination
THEMIS A SST Radiation Belts – Sample Spectra Multiple ion peaks Ions ESA ESA SST SST Elec’s ESA Lower Background Multiple electron peaks Slot Multiple Energy peaks Are common Not corrected for species cross contamination
THEMIS A SST Radiation Belts – Sample Spectra Multiple ion peaks Ions ESA SST Elec’s ESA Lower Background Color Coding by pitch angle: Red: 0o Green: 90o Blue: 180o Multiple electron peaks Slot Multiple Energy peaks Are common Not corrected for species cross contamination
THEMIS A SST Radiation Belts – Sample Spectra Multiple ion peaks Ions ESA SST Elec’s ESA Lower Background Multiple electron peaks Slot Multiple Energy peaks Are common Outer Belt Not corrected for species cross contamination
THEMIS A Radiation Belts – Sample Spectra Cut at 134 keV -B Lower Background B 90 B -B -B B Not corrected for species cross contamination
SST Calibration • Calibration Efforts: • In-flight: • Search for Steady periods of moderately high flux with single energy distribution (as Maxwellian as possible). • Calibration is based on comparison with ESA particle spectrum and extrapolation to higher energy • For Ions: • Use model of dead layer to determine energy shift for each detector (elevation angle) • For Electrons: • Determine relative geometric factor based on comparison with ESA electron spectrum. • Ground Calibration: • Just beginning ion implantation experiment with Jeff Beeman at LBL using ion beam implantation machine. • Modeling electron scattering (defocusing) using GEANT4
GEANT4 Modeling • We have created a partial 3D simulation model using GEANT4 to help determine instrument response to scattered and penetrating particles
SST Electron Low Energy Defocusing Low Energy- Large angle scattered electrons don’t hit active area of detector This spread reduces the geometric factor High Energy- Smaller angle spread nearly All electrons strike active area Foil 30 keV electrons injected (x20) 100 keV electrons injected (x20)
SST Electron sensor Calibrations FLIGHT#2 – S3A Foil 46keV 42keV Lab Calibration Data 38keV 34keV 30keV 26keV 22keV E0 E1 E2 E3 E4 Programmed Energy Channels
Applying Electron Scattering Correction SST flux Uncorrected SST flux Corrected ESA ESA SST SST Model Maxwellian
After In-flight Calibration Foil Scattering Losses
30 keV 35 keV 40 keV 45 keV SST Measured Response to mono-energetic protons PROTONS - SSL – SENSOR #11 – chn 1 Energy = 6.5 + 1.50 * bin (keV) 6.5 keV of proton energy Is lost while travelling through Dead Layer (PRE-LAUNCH!)
Calibration results Typical Proton response SST Sensor 05 - Channel 4 40 35 45 keV 30
Dead Layer (thickness grows in time) Charged Particle track Solid state detectors only measure the energy deposited in the active (depleted) region of the silicon As the dead layer grows in time all energy channels shift to higher energy Ionization charges only Collected from Depleted region Electric field Distance
Correcting for increase in Dead layer Themis E is shown Themis B&C have much more severe damage Ion Distribution Corrected Ion Distribution Uncorrected All energies Shifted up 6 keV
Summary • THEMIS SST calibrations are still in progress. We feel we understand most anomalies • If sun contaminated data bins are replaced with interpolated values then isotropic pressure calculations and velocity moments are trustworthy (spacecraft dependent) • The ion detector degradation is not uniform • Spacecraft B&C have severe degradation • Spacecraft E has only moderate degradation • Inter sensor calibrations are not (yet) good enough to trust details of pitch angle distributions • See crib sheets for more details
THEMIS Data Availability • All data is available directly at: http://themis.ssl.berkeley.edu/data • Three levels: • L0: Raw packet data- as produced on the spacecraft. Not useful to general public. • L1: Effectively equivalent to L0, but put in CDF files. Data is stored in raw (compressed) counts. No calibration factors applied. THEMIS mission specific software generally required to process this data into physical values. • L2: Processed data in physical units, but typically lacks the information needed for detailed study (i.e. lacks uncertainties, full 3D distributions). Files are periodically reprocessed as calibration parameters are updated and thus may require repeated downloads
THEMIS Software Availability • All THEMIS software is available at: http://themis.ssl.berkeley.edu/socware/bleeding_edge • Software characteristics: • Written in IDL • Machine independent, Tested on Solaris/Linux/Windows/Mac • Automatically downloads data files as needed and creates a mirror cache on local system. Subsequent file access compares dates with remote server and only downloads if needed. • Layered/modular – File retrieval & data processing, data plotting & visualization, GUI interface are separate functions. Users can select the portions of the software they wish to use. • Library based. There is no “main” program. All software is provided as a collection of functions, procedures and example “crib sheets”
My recommendations • Use the “bleeding edge” IDL software and use L1 data (the default) • Files are smaller than L2. • Files are stable (no need to redownload files as calibration parameters change) • Full access to 3D distributions for particles (not available with L2) • Visualization tools available • Use available “crib sheets” as examples • Commands (procedures and functions) can be used in your own private programs.