Download
1 / 42
420 likes | 769 Views
Engineering Probability and Statistics - SE-205 -Chap 1. By S. O. Duffuaa. Course Objectives. Introduce the students to basic probability and statistics and demonstrate its wide application in the area of Systems Engineering. Main Course Outcomes. Students should be able to perform :

E N D
Engineering Probability and Statistics - SE-205 -Chap 1 By S. O. Duffuaa
Course Objectives • Introduce the students to basic probability and statistics and demonstrate its wide application in the area of Systems Engineering.
Main Course Outcomes • Students should be able to perform: • Summarize and present data • Describe probability distributions • Compute probabilities using density/mass functions • Conduct interval estimation • Make inference about populations • Use statistical package/Minitab
Text Book and References • “Applied Statistics and Probability for Engineers “ by D. C. Montgomery and Runger, 1994. • “Probability and Statistics for Engineers and Scientists” 5th by Walpole and Mayers. • Statistics by Murry Speigel
Course Policy • Home-works and attendance 15% • Quizzes 15% • Exam1 20% • Exam II 20% • Final Exam 30%
SE- 205 Place in SE Curriculum • Central Course • Prerequisite for 7 SE courses • SE 303, SE 320, SE 323, SE 325, SE 447, SE 480, SE 463 and may be others. See SE Curriculum Tree
Engineering Problem Solving • Develop clear and concise problem description • Identify the important factors in the problem. • Propose a model for the problem • Conduct appropriate experimentation • Refine the model
Engineering Problem Solving • Validate the solution • Conclusion and recommendations
Statistics • Science of data collection, summarization, presentation and analysis for better decision making. • How to collect data ? • How to summarize it ? • How to present it ? • How do you analyze it and make conclusions and correct decisions ?
Role of Statistics • Many aspects of Engineering deals with data – Product and process design • Identify sources of variability • Essential for decision making
Data Collection • Observational study • Observe the system • Historical data • The objective is to build a system model usually called empirical models • Design of experiment • Plays key role in engineering design
Data Collection • Sources of data collection: • Observation of something you can’t control (observe a system or historical data) • Conduct an experiment • Surveying opinions of people in social problem
Statistics • Divided into: • Descriptive Statistics • Inferential Statistics
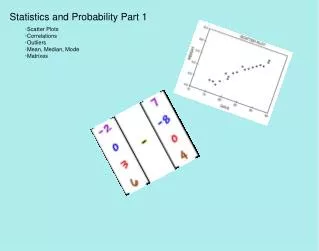
Forms of Data Description • Point summary • Tabular format • Graphical format • Diagrams
Point Summary 1) Central tendency measures • Sample Mean x = xi/n • Population Mean(µ) • Median --- Middle value • Mode --- Most frequent value • Percentile
Point Summary 2) Variability measures • Range = Max xi - Min xi • Variance = V = S 2 = (xi – x )2/ n-1 also = • Standard deviation = S S = Square root (V) • Coefficient of variation = S/ x • Inter-quartile range (IQR) (xi 2) – {[( xi) 2]/n} n -1
Diagrams: Dot Diagram • A diagram that has on the x-axis the points plotted : Given the following grades of a class: 50, 23, 40, 90, 95, 10, 80, 50, 75, 55, 60, 40. . . . . 0 50 100
Dot Diagram • A diagram that has on the x-axis the points plotted : Given the following grades of a class: 50, 23, 40, 90, 95, 10, 80, 50, 75, 55, 60, 40. . . . . 0 50 100
Graphical Format • Time Frequency Plot • The Time Frequency Plot tells the following : • 1) The Center of Data • 2) The Variability • 3) The Trends or Shifts in the data • Control Chart
Control Charts Upper control limit = 100.5 x = 91.50 Lower control limit = 82.54
Control Charts Central Line = Average ( X ) Lower Control Limit (LCL)= X – 3S Upper Control Limit (UCL)= X + 3S
Lecture Objectives • Sample and population • Random sample • Present the following: • Stem-leaf diagram • The frequency distribution • Histogram
Population and Sample • Population is the totality of observations we are concerned with. • Example: All Engineers in the Kingdom, All SE students etc. • Sample : Subset of the population 50 Engineers selected at random, 10 SE students selected at random.
Mean and Variance • Sample mean X-bar • Population mean µ • Sample variance S2 • Population variance σ2
Stem-And –Leaf Diagram • Each number xi is divided intotwo parts the stem consisting of one or two leading digits • The rest of the digits constitute the leaf. • Example if the data is 126 then 12 is stem and 6 is the leaf. What is the stem and leaf for 76
Data Table 1.1 Compressive Strength of 80 Aluminum Lithium Alloy 105 221 183 186 121 181 180 143 97 154 153 174 120 168 167 141 245 228 174 199 181 158 176 110 163 131 154 115 160 208 158 133 207 180 190 193 194 133 156 123 134 178 76 167 184 135 229 146 218 157 101 171 165 172 158 169 199 151 142 163 145 171 148 158 160 175 149 87 160 237 150 135 196 201 200 176 150 170 118 149
Stem-And-Leaf f Stem leaf frequency 7 6 1 8 7 1 9 7 1 10 5 1 2 11 5 0 8 3 12 1 0 3 3 13 4 1 3 5 3 5 6 14 2 9 5 8 3 1 6 9 8 15 4 7 1 3 4 0 8 8 6 8 0 8 12 16 3 0 7 3 0 5 0 8 7 9 10 17 8 5 4 4 1 6 2 1 0 6 10 18 0 3 6 1 4 1 0 7 19 9 6 0 9 3 4 6 20 7 1 0 8 4 21 8 1 22 1 8 9 3 23 7 1 24 5 1
Number of Stems Considerations Stem Leaf 6 1 3 4 5 5 6 7 0 1 1 3 5 7 8 8 9 8 1 3 4 4 7 8 8 9 2 3 5
Stem number considerations Stem leaf 6L 1 3 4 6U 5 5 6 7L 0 1 1 3 7U 5 7 8 8 8L 1 3 4 4 8U 7 8 8 9L 2 3 9U 5
Number of Stems • Between 20 and 5 • Roughly n where n number of data points
Percentiles • Pth percentile of the data is a value where at least P% of the data takes on this value or less and at least (1-P)% of the data takes on this value or more. • Median is 50th percentile. ( Q2) • First quartile Q1 is the 25th percentile. • Third quartile Q3 is the 75th percentile.
Percentile Computation : Example Data : 5, 7, 25, 10, 22, 13, 15, 27, 45, 18, 3, 30 Compute 90th percentile. 1. Sort the data from smallest to largest 3, 5, 7, 10, 13, 15, 18, 22, 25, 27, 30, 45 2. Multiply 90/100 x 12 = 10.8 round it to to the next integer which is 11. Therefore the 90th percentile is point # 11 which is 30.
Percentile Computation : Example • If the product of the percent with the number of the data came out to be a number. Then the percentile is the average of the data point corresponding to this number and the data point corresponding to the next number. • Quartiles computation is similar to the percentiles.
Pth percentile = (P/ 100)*n = r double (round it up & take its rank) (r) integer (take Avg. of its rank & # after) • Inter-quartile range = Q3 – Q1 • Frequency Distribution Table : 1) # class intervals (k) = 5 < k < 20 k ~ n 2) The width of the intervals (W) = Range/k = (Max-Min) /n
Class Interval (psi) Tally (# data in this interval) Frequency Relative Frequency = (Frequency/ n) Cumulative Relative Frequency 70 ≤ x < 90 || 2 0.0250 0.0250 90 ≤ x < 110 ||| 3 0.0375 0.0625 110 ≤ x < 130 |||| | 6 0.0750 0.1375 130 ≤ x < 150 |||| |||| |||| 14 0.1750 0.3125 150 ≤ x < 170 |||| |||| |||| |||| || 22 0.2750 0.5875 170 ≤ x <1 90 |||| |||| |||| || 17 0.2125 0.8000 190 ≤ x < 210 |||| |||| 10 0.1250 0.9250 210 ≤ x < 230 |||| 4 0.0500 0.9750 230 ≤ x < 250 || 2 0.0250 1.0000
Histogram 2 5 20 15 Frequency 10 5 0 70 90 110 130 150 170 190 210 230 250 Compressive Strength ( psi )
100 150 200 250 Histogram: is the graph of the frequency distribution table that shows class intervals V.S. freq. or (Cumulative) Relative freq.
Box Plot Whisker extends to largest data point within 1.5 interquartile ranges from third quartile Whisker extends to smallest data point within 1.5 interquartile ranges from first quartile Third Quartile First Quartile Second Quartile Extreme Outliers Outliers Outliers Extreme Outliers 1.5 IQR 1.5 IQR IQR 1.5 IQR 1.5 IQR
100 150 200 250 Strength
120 110 100 Quantity Index 90 80 70 1 3 2 Plant