Download
1 / 42
420 likes | 578 Views
Increasing innovation in undergraduate engineering design teams. ^. an exploratory study. Sara Scharf Postdoctoral Fellow, Behdinan Lab Faculty of Applied Science and Engineering, U of T. Increasing innovation in undergraduate engineering design teams. Defining and measuring innovation

E N D
Increasing innovation in undergraduate engineering design teams ^ an exploratory study Sara Scharf Postdoctoral Fellow, Behdinan Lab Faculty of Applied Science and Engineering, U of T
Increasing innovation in undergraduate engineering design teams • Defining and measuring innovation • Removing/reducing barriers to innovation • Methods • Results • Implications
Defining and measuring innovation Buzzword practical solutions • How can we increase it? • How can we measure it? • How can we do all this with limited time, personnel, and other resources?
What is innovation? Definitions are highly context-dependent on, e.g., • Field/company • Academia • Industry • Government • Measures of success • Patentability • Income generation • Improved quality of life • Location/scale • Local vs. global • Timeframe • Differences from existing processes/products • Incremental • Radical • Disruptive
Innovation is some kind of change that people like. i = Δx +
Increasing and measuring innovation No magic formula for innovation! • What contexts lead to innovation? • What contexts suppress innovation? What do we have control over in a classroom situation with students already enrolled? • ~250 students • Teams of 4 • Highly multicultural
Increasing innovation in undergraduate engineering design teams • Defining and measuring innovation • Removing/reducing barriers to innovation • Methods • Results • Implications
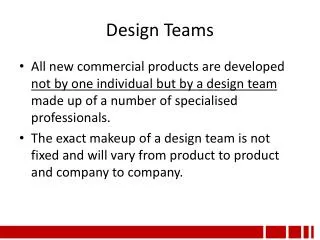
Removing/reducing barriers to innovation • Students do most of their work in teams • Good team dynamics increased likelihood of innovation • Team learning • Sharing of ideas • Poor team dynamics reduced likelihood of innovation • Defensiveness/lack of sharing
Removing/reducing barriers to innovation Most team-level problems in previous years were related to language cliques • Social exclusion • Lack of practice in English • Students translating for students • Lack of exposure to multicultural environment
Removing/reducing barriers to innovation Hypothesis 1. • Breaking up language cliques will reduce problems with team dynamics • Students must interact with others from different backgrounds • English now the only common language within teams • Forces students to speak in English • Unilingual speakers of English dispersed • Must slow down to accommodate others
Removing/reducing barriers to innovation Hypothesis 2. • Students comfortable dealing with people different from themselves will feel more comfortable in their teams Hypothesis 3. • The more comfortable students are on their teams, the better team dynamics will be Hypothesis 4. • Better team dynamics innovation
Increasing innovation in undergraduate engineering design teams • Defining and measuring innovation • Removing/reducing barriers to innovation • Methods • Results • Implications
Methods Surveys used to record: • Linguistic competency used to break up cliques • Multicultural competency comfort with difference • Psychological safety comfort on teams • mid-project and end of project • Innovativeness • student self, peer, and team ratings • TA ratings of teams • Age • Gender Additional information: team project grades and final grades
Methods Surveys administered in 3 “bundles” • First week of class • Mid-term • After final project • 1 to 2 marks awarded to students for completing each bundle of surveys • Marks given regardless of students’ consent to allow their data to be used for research
Methods: team formation informed by linguistic competency Mandatory language competency survey + team formation algorithm • Input: chatting competency* • Output: teams with • No more than 50% of students on any team use the same non-English language • No more than 50% of students on any team use only English * And some other measures used for other research projects running in the same class, i.e. working styles (Bolton and Bolton 1996) and learning styles (Austin 2004).
Methods: multicultural competencies Multicultural competencies • How much individuals enjoy working with people from cultures different from their own • Multicultural Personality Questionnaire (MPQ) (van der Zee et al. 2010) • Validated questionnaire used in multiple contexts and countries • High multicultural competencies correspond with success in multicultural environments
Methods: psychological safety Psychological safety (Edmondson 1999, Edmondson and Lei 2014) • Feeling it is OK to take particular interpersonal risks even when “admitting ignorance or uncertainty, voicing concerns and opinions, or simply being different” • Used the most common psychological safety questions in the literature • High psychological safety correlates with increased sharing of ideas (= potential for innovation)
Methods: measuring innovativeness Questions address different components of process and product innovation, i.e. • Demonstrating originality • Generating new ideas • Identifying opportunities • Looking for new ways to solve problems • Implementing new ideas • Suggesting new ways to achieve goals • Seeking out new technologies to achieve solutions • Linking ideas • Thinking flexibly
Methods: measuring innovativeness • Questions derived from multiple sources • Combination unique in the literature • Multiple rating techniques used to triangulate best way to assess in the future
Increasing innovation in undergraduate engineering design teams • Defining and measuring innovation • Removing/reducing barriers to innovation • Methods • Results • Implications
Results • Participation and consent rates for all 3 survey bundles between 75% and 99% • Not everyone who filled out any one survey filled out the other two
Validity of language questions Exploratory factor analyses excellent validity! • High correspondence among most language skills in all languages tested (loadings > 0.7) • Biggest gap: Mandarin Chinese self-expression vs. reading and writing skills • Students who can’t read or write can still chat • Self assessment of chatting ability is therefore a valid way to assess the language(s) students are likely to use in class
Languages used by Praxis II students Notes: 215 students consented, but chart shows 238 responses because some students use >1 non-English language. “Other” includes Bangla, Belarusian, Filipino (Tagalog), Finnish, German, Hebrew, Hindi, Japanese, Malay, Polish, Punjabi, Romanian, Russian, Serbo-Croatian, Sinhala, Tamil, Telugu, Tibetan, Turkish, and Urdu.
Best-rated languages used by Praxis II students for chatting Note: Data set of 109 consenting students.
Results: team formation informed by linguistic competency • >60% reduction in team breakdowns over previous years (3 vs. an average of 8/year) • No students translating for other students • No non-English chatting in tutorials • Increased participation and attentiveness in tutorials Increase in positive learning environment!
Validity of MPQ • Correlation analysis: 5 subcategories are appropriately distinct from one another • Significant correlation (P < 0.001) between cultural empathy and emotional stability scores and scores on some psychological safety questions but • No significant correlations between multicultural competency and other measures • Language differential between best language and English (overall, chatting) • Age • Gender • Team innovativeness • Grades, etc.
Validity of psychological safety questions • Psychological safety questions not well-tested in intercultural/multicultural/multilingual environments before (Edmondson and Lei 2014) • Authors unsure of validity in contexts where saving face is a significant cultural value
Validity of psychological safety questions • One question was misunderstood by many students: “No one on this team would deliberately act in a way that undermines my efforts.” This question: U-shaped distribution Most questions: skewed normal distribution
Validity of psychological safety questions • Slight increases in psychological safety from mid-project to end of project but • Correlation analyses suggest questions may be measuring different concepts (loadings < 0.5) . . . even excluding the misunderstood question and • Significant correlations only of • “My unique skills are valued” with the ability to chat and to do a job interview (P < 0.001), and • “Tough issues” and “feeling of trust” with team final grades (P < 0.001) but not team project grades
Innovativeness ratings • Self- and peer ratings corresponded closely =4.2 =3.8 =3.6 = 4 Mean = 3.9 SD = 0.86 Mean = 3.8 SD = 0.74
Innovativeness ratings • Mean peer ratings per team and student ratings of teams as a whole corresponded closely Mean = 3.8 SD = 0.65 Scores quite similar Mean = 4.0 SD = 0.78
Innovativeness ratings • Whole teams rated more highly than mean of teammate ratings (P <0.01) • Team synergy?
Innovativeness ratings • Assessor ratings of the teams were very different from student ratings • Assessor ratings agreed with each other Our team is innovative! Score = 4.5/5* Nothing innovative here. 0/5* Yup. *different scales normalized to be out of 5
Increasing innovation in undergraduate engineering design teams • Defining and measuring innovation • Removing/reducing barriers to innovation • Methods • Results • Implications
Implications: survey methodology • Giving marks for participation in surveys yields excellent participation rates!
Implications: linguistic diversity(Hypothesis 1) • Optimizing linguistic diversity on teams in highly multicultural classes • reduces language-related problems in class • improves learning environment • Language questions developed for this study can become new tool for assessing language competencies
Implications: multicultural competency(Hypothesis 2) • Mean team multicultural competency not significant in the success of undergraduate engineering design teams • Correlations between some MPQ questions and some PS questions at the individual level should be investigated further
Implications: psychological safety(Hypothesis 3) • Psychological safety as measured does not significantly correlate with team performance, etc. • Psychological safety questions need to be redesigned for use with subjects with varied English competencies
Implications: measuring innovation(Hypothesis 4) • Fewer student rating scales needed to produce similar results but • Team synergy could be investigated in more detail • Student questionnaires should be modified to reduce skew and expand range of responses • More, similar questions • Negative phrasing for some items
Implications: measuring innovation(Hypothesis 4) • Lack of correspondence between student ratings and assessor ratings likely indicates poor student self- and peer assessment abilities • Not uncommon for first-year students Measuring and increasing innovation – we’re not there yet, but we’re on our way!
Acknowledgements Thanks to my supervisor, Kamran Behdinan, and to Jason Foster, coordinator of Praxis II, the class surveyed in this study Logistics Patricia Sheridan Penny Kinnear Statistics Chris Hitchcock Deborah Scharf Gayle Vierma Team formation algorithm Tim Chan Daria Terekhov DeryaDemirtas Brendan Eagan Additional thanks to: This research was funded through NSERC grant #11206-105766 to Kamran Behdinan