Download
1 / 15
150 likes | 279 Views
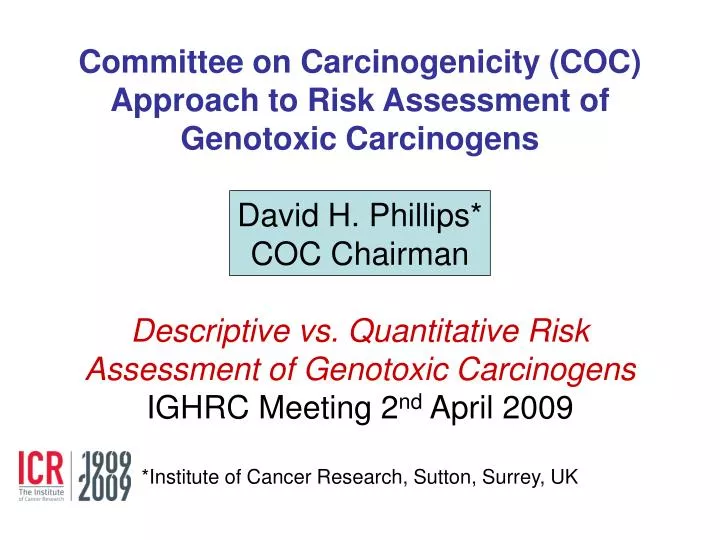
Committee on Carcinogenicity (COC) Approach to Risk Assessment of Genotoxic Carcinogens David H. Phillips* COC Chairman Descriptive vs. Quantitative Risk Assessment of Genotoxic Carcinogens IGHRC Meeting 2 nd April 2009 *Institute of Cancer Research, Sutton, Surrey, UK.

E N D
Committee on Carcinogenicity (COC) Approach to Risk Assessment of Genotoxic CarcinogensDavid H. Phillips*COC ChairmanDescriptive vs. Quantitative Risk Assessment of Genotoxic CarcinogensIGHRC Meeting 2nd April 2009*Institute of Cancer Research, Sutton, Surrey, UK
Guidance documents from Committees on Carcinogenicity (COC) and Mutagenicity (COM)
4-stage evaluation strategy for the risk assessment process of carcinogenic hazard • Hazard identification • Hazard characterisation • Exposure assessment • Risk characterisation
1. Hazard identification Recognition of adverse effects from: • Epidemiological evidence • Long-term animal bioassays • Short-term studies in animals • Mutagenicity studies in vitro and in vivo (see COM guidance) • Mechanism: genotoxic v non-genotoxic?
2. Hazard characterisation Qualitative description of the nature of the hazard Quantitative description of the dose-response relationship • Evidence from epidemiological studies • Dose-response data from animals studies • ADME (absorption, distribution, metabolism, excretion) Data to assist extrapolation from animals to humans • Clarify differences in species, sex, age, tissue, route of exposure Establish relevance to humans; define Mode of Action (MOA)
2. Hazard characterisation (cont.) Potency estimates • T25 – dose eliciting a 25% increase in incidence of a specific tumour above background level • For potency ranking of genotoxic carcinogens this is an acceptable pragmatic approach • There are uncertainties about whether relative ranking identified in observed dose range would be maintained at low doses
2. Hazard characterisation (cont.) Potency estimates • TD50 – chronic dose-rate which would induce tumours in a given target site in 50% of test animals (if no tumours in controls) or dose rate that halves probability of animal remaining tumour free • Evaluation of tumour incidence complicated by early mortality and failure to observe tumour onset prior to death Use of potency estimates best confined to priority setting and ranking of carcinogens
3. Exposure assessment Critical for assessment of risk, but often the main area of uncertainty • Knowledge of external dose/concentration • Internal dose – levels of chemical or metabolites in biological samples • Biomarkers of exposure (e.g. adducts) – can represent target dose but may only reveal short-term or medium-term exposure • Biomarkers of effect (e.g. cytogenetic changes) – some recent advances in validation; usually not exposure- or agent-specific
4. Risk characterisation • Establish Mode of Action (MOA) • If genotoxic, exposure should be As Low As Reasonably Practicable (Achievable) – ALARP (or ALARA) • If non-genotoxic, derive Margin of Safety (MOS) based on No Observed Adverse Effect Level (NOAEL)
Quantitative risk assessment (QRA) • Produces numerical estimates of cancer risk • Usually carried out using data from animal carcinogenicity studies because insufficient human data are available • However, there are significant uncertainties because the models are not based on biological mechanisms and the data are extrapolated to well below the range of doses given to animals
1 Observed data 0.1 One Hit 0.01 Multistage 0.001 Theoretical data 0.0001 Logit Weibull 0.00001 Probit 0.000001 10 0.0000001 0.00001 0.001 0.1 Result of using different quantitative cancer risk models when modelling the same data set No. of cases of cancer per lifetime Dose (mg/kg bw/day)
Margin of Exposure approach for genotoxic carcinogens • A technique developed to assist in the management or communication of risks from genotoxic carcinogens (not risk assessment) • Compares Point of Departure (POD) with the actual exposure to a chemical and makes a judgement on the basis of the ratio between the two, i.e. Margin of Exposure = POD Exposure
The benchmark dose 60 50 5050 40 Best fit to experimental data points % Response Lower 95% confidence interval on dose giving a 10% response 30 10% response = BMR 20 10 BMDL10 BMD10 1 10 Daily dose
Summary • Range of data available means evaluation will be on a case-by-case basis • 4 stages: hazard identification, hazard characterisation, exposure assessment, risk characterisation • If non-genotoxic, may apply a threshold approach – NOAEL + uncertainty factors – Margin of Safety (MOS) • If genotoxic, then non-threshold. Extrapolation of dose-response curves to low dose is imprecise. Recommend ALARP • Consider MOE for risk communication