Download
1 / 32
320 likes | 497 Views
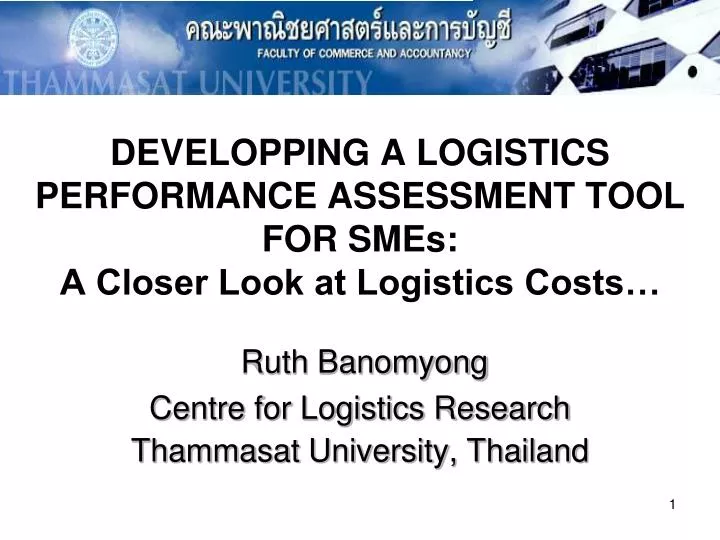
DEVELOPPING A LOGISTICS PERFORMANCE ASSESSMENT TOOL FOR SMEs : A Closer Look at Logistics Costs…. Ruth Banomyong Centre for Logistics Research Thammasat University, Thailand. Agenda. Background Framework Development Methodology Findings Some Comments ...

E N D
DEVELOPPING A LOGISTICS PERFORMANCE ASSESSMENT TOOL FOR SMEs: A Closer Look at Logistics Costs… Ruth Banomyong Centre for Logistics Research Thammasat University, Thailand
Agenda • Background • Framework Development • Methodology • Findings • Some Comments... • A closer look at logistics costs...
Background • Logistics management is recognised as a key opportunity to improve profitability and firms’ competitive performance (Lambert et al., 1998). • However, It is important for firms to be able to assess their own logistics performance as a starting reference. • Current assessment tools are not user friendly.
Background • The purpose of this presentation is to introduce a logistics performance assessment tool (LPAT). • The objective of the LPAT is to measure the performance of a firm’s key logistics activities under different performance dimensions.
Background • The literature on the subject of performance measurement in logistics had common theme (Bowersoxet al., 1989; Byrne & Markham 1991; Keebleret al,. 1999; Griffiset al., 2004): • Most firms do not comprehensively measure logistics performance, • Even the best performing firms fail to realise their productivity and service potential available from logistics performance measurement, and; • Logistics competency will increasingly be viewed as a competitive differentiator and a key strategic resource for the firm.
Order processing & Logistics communications Customer service & support Demand forecasting & planning Purchasing & procurement Material handling & packaging Inventory management Transportation Facilities site selection, warehousing & storage Return goods handling and reverse logistics Framework: 9 Key Logistics Activities Source: Grant et al., 2006
Methodology • A questionnaire was developed based on the logistics activities performance framework. • 25 SMEs respondents were selected to answer the questionnaire while one Thai multinational was also requested to answer the assessment questionnaire. • The 25 SMEs were composed of firms in the automotive sector, electronic, jewelry, furniture, and rubber industry.
Methodology • Respondents understood data requirement well. However only 2 were able to fill the whole questionnaire. • Cost data was the most difficult to complete. Respondents with ISO have more available data. • Data provided by Thai MNE could serve as a reference point.
Findings • The data collected was compared with an existing logistics and supply chain benchmarking database http://www.benchmarkingsuccess.com • The logistics performance out put based on the 3 performance dimensions are illustrated in the following slides…
Cost KPIs Performance Customer service 0 . 5 - 5 % < 0 . 5 % > 5 % cost per sale Procurement 0 . 5 - 5 % < 0 . 5 % > 5 % cost per sale W Info processing 0 . 5 – 5 % > 5 % < 0 . 5 % O cost per sale R Transportation 1 – 10 % < 1 % > 10 % cost per sale L D Warehousing 0 . 5 - 8 % < 0 . 5 % > 8 % cost per sale C Forecasting cost 0 . 5 - 5 % < 0 . 5 % > 5 % per sale L Inv holding cost A 0 . 5 - 5 % < 0 . 5 % > 5 % per sale S Value damage S 0 . 1 – 3 % < 0 . 1 % > 3 % per sale Returned goods 0 . 5 - 3 % < 0 . 5 % > 3 % cost per sale Disadvantage Parity Advantage = Group Average = Top Thai company
Time KPIs Performance Avg order cycle 7 – 10 days < 7 days > 10 days time Avg procurement 13 – 18 days < 13 days > 18 days cycle time W Avg order processing 1 – 2 days < 1 days > 2 days O cycle time R Avg delivery 1 – 3 days < 1 days > 3 days cycle time L D Avg inventory 6 hr – 2 days < 6 hours > 2 days cycle time C Avg forecast N . A . N . A . N . A . period L Avg inventory A 10 – 40 d < 10 days > 40 days day S Avg material S > 7 days 1 – 7 days < 1 days handling and packaging cycle time Avg cycle time for 1 – 3 days < 1 days > 3 days customer return Disadvantage Parity Advantage = Group Average = Top Thai Company
Reliability KPIs Performance DIFOT 80 - 95 % > 95 % < 80 % ( CS and Support ) Supplier In Full and 80 - 95 % > 95 % < 80 % On - Time Rate W Order Accuracy 90 - 98 % > 98 % < 90 % O Rate R DIFOT > 95 % < 80 % 80 - 95 % ( Transportation ) L D 90 – 99 % > 99 % < 90 % Inventory Accuracy C Forecast Accuracy 60 - 90 % > 90 % < 60 % Rate L A Inventory Out of > 10 % 2 - 10 % < 2 % Stock Rate S S 1 - 5 % < 1 % > 5 % Damage Rate Rate of Returned > 5 % 0 . 1 – 5 % < 0 . 1 % Goods Disadvantage Parity Advantage = Group Average = Top Thai Company
Some Comments... • The LPAT tool could still be further simplified to make data collection easier. • Key logistics activities are not equal in importance • Further refinement of the logistics activities performance framework is needed…
Some Comments... • The objective would be to identify maybe not more than 2 or 3 key logistics KPIs per performance dimension that could illustrate firms’ overall logistics performance. • A composite performance metrics is currently under consideration. • The development of this tool is an ongoing process.
A Closer Look at Logistics Cost... • Difficult to identify all logistics activity cost. • ABC can support the identification of cost of each logistics costing. However, difficult to implement. • Logistics cost ratio per sales is the most common indicator... • National Logistics cost? • C2C metric to reflect supply chain performance? An example.
Ratio of selected export logistics cost (FOB) in ASEAN Source: (USAID, 2006)
Export Logistics costs component / Total Logistics costs Procurement Inventory 13 % 4 % Export Warehousing 45 % 7 % Transport 31 %
Thailand Logistics Costs/GDP Source: Ruth Banomyong (2007)
Some Future trends... • Macro Logistics cost is increasing • Transport cost • Inventory carrying cost • Thammasat Annual Logistics Index (3rd quarter)
The C2C cycle in the supply chain:Thai shrimp export to the US
C2C definitions Source: Farris II and Hutchison (2001)
C2C time (days) in the US Source: MDM (2000))
Thank you for your attention Questions & Answers