Download
1 / 63
680 likes | 1.36k Views
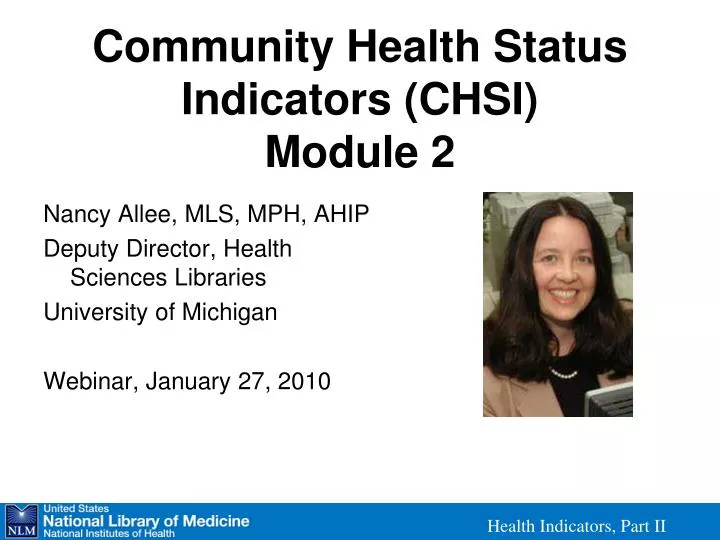
Community Health Status Indicators (CHSI) Module 2. Nancy Allee, MLS, MPH, AHIP Deputy Director, Health Sciences Libraries University of Michigan Webinar, January 27, 2010 . Health Indicators, Part II. Health indicators: 4-part series. Part I: “Health Indicators: Overview”

E N D
Community Health Status Indicators (CHSI)Module 2 Nancy Allee, MLS, MPH, AHIP Deputy Director, Health Sciences Libraries University of Michigan Webinar, January 27, 2010 Health Indicators, Part II
Health indicators: 4-part series • Part I: “Health Indicators: Overview” • Wednesday, January 20th, 1:00pm EST • Understand the variety of health indicators, their data sources, their key attributes, context and use • Presenter: Cheryl Wold, Wold & Associates • Part II: “Community Health Status Indicators (CHSI)” • Wednesday, January 27th, 1:00pm EST • Learn to navigate and use the Community Health Status Indicators (CHSI) effectively to find county-level data • Presenter: Nancy Allee, Deputy Director, Health Sciences Libraries, University of Michigan • Part III: “Practical Approaches for Using Health Indicators” • Wednesday, February 3rd, 1:00pm EST • Discover ways in which librarians can become more engaged with others in improving the health of their communities and become knowledgeable about ways in which CHSI data can be used in working with the public health practice community • Presenter: Nancy Allee, Deputy Director, Health Sciences Libraries, University of Michigan • Part IV: “Examples of Important New Indicator Projects” • Date/Time: To Be Announced • Become familiar with several important indicator efforts including State of the USA, MATCH, and two local level examples • Presenter: Cheryl Wold, Wold & Associates • Registration: http://www.nlm.nih.gov/nichsr/healthindicators/ Health Indicators, Part II
Today’s presentation Focus on: the Community Health Status Indicators Goal: Learn to navigate and use the Community Health Status Indicators effectively to find local data • accessing • searching • mapping • generating county-level reports Question: How can librarians engage with the public health workforce and local communities in using health indicator resources for quality improvement? Health Indicators, Part II
Presenter’s backgroundNancy Allee (nallee@umich.edu) Degrees in Library Science & Public Health MLA CE’s • Community Health Status Indicators • Evidence Based Public Health • Public Health 2.0 (Social Media) NLM & Partners in Information Access • Chair: Public Health Training Subcommittee • Project Director: Public Health Information & Data Tutorials project & developer of Evidence Based Public Health Module Past chair of the Public Health / Health Administration Section of the Medical Library Association Health Indicators, Part II
What is public health? • Prevents epidemics and the spread of disease • Protects against environmental hazards • Prevents injuries • Promotes and encourages healthy behaviors • Responds to disasters and assists communities in recovery • Assures the quality and accessibility of health services • Source: Public Health Functions Steering Committee, Fall 1994. Health Indicators, Part II
10 Essential Public Health Services • Monitor health status to identify community health problems • Diagnose and investigate health problems and health hazards in the community • Inform, educate, and empower people about health issues • Mobilize community partnerships to identify and solve health problems • Develop policies and plans that support individual and community health efforts • Enforce laws and regulations that protect health and ensure safety • Link people to needed personal health services and assure the provision of health care when otherwise unavailable • Assure a competent public health and personal health care workforce • Evaluate effectiveness, accessibility, and quality of personal and population-based health services • Research for new insights and innovative solutions to health problems • Source: Public Health Functions Steering Committee, Fall 1994. http://www.health.gov/phfunctions/public.htm Health Indicators, Part II
What is CHSI (Community Health Status Indicators)? A collection of nationally available health indicators for counties, helping to present a “total picture” of local health. A resource for monitoring and analyzing community health status and its determinants at the county level. The goal of CHSI is to give local public health agencies another tool for improving their community’s health by identifying data resources and facilitating the setting of priorities. CHSI supports the mission and goals of public health, the 10 essential public health services, Healthy People 2010 initiatives, and evidence-based policy and research.
Partners • Federal partners • Agency for Toxic Substances and Disease Registry (ATSDR) • Centers for Disease Control and Prevention (CDC) • Health Resources Services Administration (HRSA) • National Library of Medicine (NLM) • Private partners • Association of State and Territorial Health Officials (ASTHO) • Johns Hopkins University Bloomberg School of Public Health • National Association of County and City Health Officials (NACCHO) • National Association of Local Boards of Health (NALBOH) • Public Health Foundation (PHF) • Robert Wood Johnson Foundation (RWJF) Health Indicators, Part II
Uses of & users of CHSI and health indicators • Uses of • Public policy • Public health programs • Interventions • Partnerships • Research • Grants • Publications • Users of • Public health officials • Public health workers • Librarians • Academics • Government agencies • Nonprofit organizations • General public • Anyone with an interest in local public health data Health Indicators, Part II
CHSI data sources • Air Quality Reporting System & Toxic Release Inventory (EPA) • Behavioral Risk Factor Surveillance System (BRFSS) • Centers for Medicare & Medicaid Services • Harvard Initiative on Global Health • Infectious Diseases Reporting System (CDC) • National Vital Statistics System (CDC) • Substance Abuse and Mental Health Services Administration (SAMHSA) • U.S. Census Bureau & Bureau of Labor Statistics - Current Population Survey Health Indicators, Part II
CHSI & evidence-based decision-making • Comparison to peer and other U.S. counties • Symbols • Apple = favorable status • Magnifying glass = unfavorable status Health Indicators, Part II
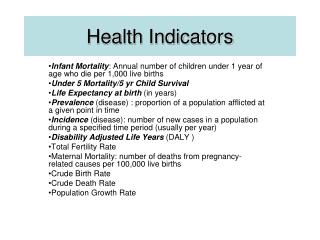
What are indicators? • An indicator is “a summary measure that aims to describe in a few numbers as much detail as possible about a system to help understand, compare, predict, improve, and innovate.” • Source: • The Good Indicators Guidehttp://www.apho.org.uk/resource/item.aspx?RID=44584 Health Indicators, Part II
What are health indicators? • A health indicator is “a characteristic of an individual, population, or environment which is subject to measurement and can be used to describe one or more aspects of the health of an individual or population.” • Source: • Definition of Wellness web sitehttp://www.definitionofwellness.com/dictionary/health-indicator.html Health Indicators, Part II
What is the “community” in Community Health Status Indicators? • Individual counties • data for 3,141 U.S. counties • Peer counties • counties similar in population size and other selected characteristics (e.g. poverty level, age distribution, density) Health Indicators, Part II
Some mythsabout health indicators • Only local indicators are relevant for local people. • Unless the data are perfect, the indicator is useless. • Measurement eliminates uncertainty and argument. • Only a few indicators are needed to understand how a system is working. • Source: • The Good Indicators Guidehttp://www.apho.org.uk/resource/item.aspx?RID=44584 Health Indicators, Part II
Some truths about health indicators • Indicators only indicate – they are not the whole story. • Indicators are ideally linked to quality improvement. • “Measurement is necessary for improvement but is not sufficient on its own.” • David Pencheon, The Good Indicators Guide • “I am not interested in measurement per se. I am obsessed by improvement and the role measurement has in that process.” • Don Berwick, Institute for Healthcare Improvement • Source: • The Good Indicators Guidehttp://www.apho.org.uk/resource/item.aspx?RID=44584 Health Indicators, Part II
CHSI health indicators • Demographics • Summary measures of health • National leading causes of death • Measures of birth and death • Relative health importance • Vulnerable populations • Environmental health • Preventive services use • Risk factors for premature death • Access to care Source:http://www.communityhealth.hhs.gov/Companion_Document/CHSI-Data_Sources_Definitions_And_Notes.pdf Health Indicators, Part II
CHSI health indicators Demographics Population size Poverty level Population by age Population by race/ethnicity Health Indicators, Part II
CHSI health indicators Summary measures of health Average life expectancy Rates of death Self-rated health status Average unhealthy days Health Indicators, Part II
CHSI health indicators National leading causes of death Complications of pregnancy/birth Birth defects Injuries Homicide Cancer Suicide Heart disease HIV/AIDS Health Indicators, Part II
CHSI health indicators Measures of birth and death Birth Low birth weight, very low birth weight, premature births Death Infant mortality, breast cancer, colon cancer, coronary heart disease, homicide, stroke Health Indicators, Part II
CHSI health indicators Relative health importance Highlights favorable and unfavorable health status between peer counties and the U.S. in general Health Indicators, Part II
CHSI health indicators Vulnerable populations Have no high school diploma Unemployed Severe work disability Major depression Recent drug use Health Indicators, Part II
CHSI health indicators Environmental health Clean air, water, land, waste disposal Data on infectious diseases Standards for pollutants and toxic chemicals Health Indicators, Part II
CHSI health indicators Preventive services use Pap tests, mammograms, colonoscopy, vaccines Health Indicators, Part II
CHSI health indicators Risk factors for premature death Lack of exercise Poor nutrition Obesity High blood pressure Smoking Diabetes Health Indicators, Part II
CHSI health indicators Access to care Number of uninsured Number of Medicare enrollees Number of primary care physicians Health professional shortage areas Health Indicators, Part II
Peer counties 88 strata or peer groups defined in CHSI, using 5 factors: Frontier status Population size Poverty quartiles Median age Population density Health Indicators, Part II
How can I access the CHSI web site?http://www.communityhealth.hhs.gov/
CHSI: “Home” Health Indicators, Part II
CHSI: “About the data” Health Indicators, Part II
CHSI: “Data details” Health Indicators, Part II
CHSI: “About the project” Health Indicators, Part II
CHSI: “How to use your county’s report” Health Indicators, Part II
CHSI: “Partners” Health Indicators, Part II
CHSI: “Resources” Health Indicators, Part II
CHSI: “Resources” cont’d Health Indicators, Part II
CHSI: Mapping & reports Health Indicators, Part II
CHSI sample search Health Indicators, Part II
Focus on Wayne County, MI Health Indicators, Part II
Demographics: Wayne County, MI Health Indicators, Part II
Measures of birth and death: Wayne County, MI Health Indicators, Part II
Low Birth Wt. (<2500 g) Very Low Birth Wt. (<1500 g) Premature Births (<37 weeks) Births to Women under 18 Births to Unmarried Women No Care in First Trimester Infant Mortality White non Hispanic Infant Mortality Black non Hispanic Infant Mortality Hispanic Infant Mortality Neonatal Infant Mortality Post-neonatal Infant Mortality Breast Cancer (Female) Colon Cancer Coronary Heart Disease Homicide Lung Cancer Stroke Relative health importance: Wayne County, MI Unfavorable health indicators – both Peers and U.S. Health Indicators, Part II
Vulnerable populations: Wayne County, MI Health Indicators, Part II
Environmental health: Wayne County, MI Health Indicators, Part II
Preventive services use: Wayne County, MI Health Indicators, Part II
Preventive services use: infectious disease cases: Wayne County, MI