Download
1 / 18
180 likes | 296 Views
Experiences using a local AVHRR receiving station to assist monitoring of Central American volcanoes. Peter Webley KCL. AVHRR Real time Volcano Monitoring Project. Objectives Improve geological and geotechnical hazard avoidance capacity

E N D
Experiences using a local AVHRR receiving station to assist monitoring of Central American volcanoes Peter Webley KCL
AVHRR Real time Volcano Monitoring Project • Objectives • Improve geological and geotechnical hazard avoidance capacity • Improve capacity for low cost, rapid hazard, risk and vulnerability assessment • Development systems for maintaining and improving national geoscience information • Assess the capability of remote sensing for enhancing operational volcano monitoring • Incorporates both geophysical and social science components
AVHRR Real time Volcano Monitoring Project • Accomplishments • Installation of the AVHRR receiving station • Provided the software to allow the INETER staff to capture the data in real time • Designed and installed automated capture and analysis system • Carried out extensive case studies into the application of AVHRR to monitor and detect thermal volcanic activity • Designed analysis system to monitor volcanoes in Nicaragua, Guatemala, El Salvador and Costa Rica • Development of web based interface for data download and thermal monitoring • Multi-National Workshop in Nicaragua during March 2004 • Developments • Thermal fingerprint to detect eruption • E-mail alert system • Assessment of operational use of system • Ash cloud monitoring system
Co-operating Countries and Partners • Countries • Nicaragua, Guatemala, Costa Rica and El Salvador • UK, USA and Japan • Partners • BURS – Bradford University Remote Sensing • KCL – Kings College London • INETER - Instituto Nicaraguense de Estudios Territoriales • CONRED - Comisión Nacional para Reducción de Desastres • INSIVUMEH – Instituto Nacional de Sismologia, Vulcanologia, Meteorologia e Hidrologia. • SNET - Servicio Nacional de Estudios Territoriales • OVSICORI - Observatorio Vulcanológico y Sismológico de Costa Rica • MTU – Michigan Technology University • University of Tokyo
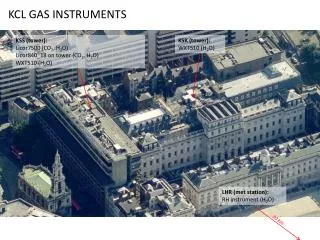
AVHRR Receiving Station and Data • Swath area : 2000 km * 2000km • 6 - 8 satellite passes per day • Data • 5 Spectral Channels • Measuring Reflectance and Temperature • At 1.1 km resolution at nadir • Analysis • Use T3– T4 to look at volcanic activity • Determine radiance for the hotspot pixels • Use T4– T5 for ash cloud test • Provide time series of important data
AVHRR Capture Software • Data Capture • Data calibration • Data converted to universal format • Processing fully automated
Capture System : Automatic • NOAA Scheduler • Carries out orbit planning, data capture and data calibration • Conversion to universal format automated
Computing/Data Storage • Computing • Data Capturing • Data Analysis • Software • BURS • ENVI/IDL • Data files • RAW – 10 – 40 MB • ENVI BIL – 90 – 180 MB • Data Storage • Per day: 400 – 500 MB • CD backup • Copied each week • Storage within INETER • Development to DVD storage • Analysis outputs • Stored on PC • Displayed on website
Analysis System : Stage 1 • Uses IDL/ENVI • Automatically compiles and runs code if pass within past 30 minutes • If no pass, then will close and re-load in 30 minutes • Loads AVHRR scene into ENVI and extracts the following data • Channels 1 to 5, Latitude and Longitude • Satellite Azimuth, Satellite Elevation, Sun Azimuth and Sun Elevation • 8 volcanoes in Nicaragua, 8 in Guatemala, 4 in Costa Rica and 4 in El Salvador • Assigns a pixel corresponding to the volcano summit • For each volcano, program carries out the following analyses • Find the Max Temp 3 – 4 close to the summit pixel • Determines Thresholds to detect ‘hot/anomalous’ pixels • Determines Radiance anomalies • Carries out Cloud Analysis of region surrounding the volcano
Analysis System : Stage 2 • Finds the Maximum Temp 3 – 4 value in a 7 by 7 grid from summit pixel • Determines this is be an anomalous pixel and creates 7 by 7 grid around hotspot pixel • Determines the mean and standard deviation of this new array • Analyses to determine which pixels are anomalous. If none, then no radiance calculations • Uses these anomalous pixels in Radiance calculations
Analysis System : Stage 3 • Calculates the Radiance for Channels 3, 4 and 5 from equation: λ = wavelength (m) T is temperature (K) L is Spectral Radiance (W/m2/sr/μm) h is Planck’s Constant (6.6*10-34 Js) k is Boltzmann’s constant (1.38*10-23 J/K) c is the speed of light (3*108 m/s) • Calculates 3 Radiance anomalies for those ‘hot’ pixels • Σ (Equivalent anomaly) • Radiance from Channel 3 – Radiance from Channel 4 equivalent to Channel 3 (T3, λ4) • Σ (Simulated anomaly) • Radiance from Channel 3 – Radiance from Channel 3 simulated • Simulated temperature from linear relationship between Channel 3 and 4 • Σ (Background anomaly) • Radiance from Channel 3 – Radiance from Channel 3 background • Background temperature from edge pixels of 7*7 grid
Analysis System : Stage 4 • Determines fully georeferenced images for all 24 volcanoes in Central America • Creates text file outputs • Including Channels 1 to 5, Channels 3 – 4, 4 – 5 at volcano summit and hotspot • Latitude and Longitude at volcano summit and hotspot • Number of saturated pixels • Ash cloud pixels • Radiance anomalies • Updates time series figures for each volcano • Past week • Past month • Last 6 months (rolling) • Max per day • Creates ASCII gridded data centred on each volcano • Creates ENVI image files so user can analyse the data themselves • Creates ARCVIEW raster and shape files
Outputs from Analysis (1) • Text file based outputs for each volcano • Channels 1 to 5 at Summit and hotspot • Channels 3 – 4 and 4 – 5 at summit and hotspot • Ash based and Saturated based pixels • Three Radiance anomalies • Distance between summit and hotspot • CI and Cloud value for summit pixel Cloud index + Summit value Radiance anomalies Date and time of image Channels 3, 4 and 5 at hotspot
Outputs from Analysis (2) • Fully georeferenced images for each country and volcano • Processed data in real-time for own personal analysis • Gridded text files of AVHRR data for each volcano • Time series plots of text data.
Data Availability • Real-time data accessible from website • Fully georeferenced imagery • Time series of Radiance anomalies • Gridded data around each volcano • Image files to allow users to carry own analysis. • Access to data by web site for all volcanoes by end of Sept 2004 • Data for Research • Access provided so user can order past data for research purposes. • Data available from March 2003 until present • Process for ordering and sending data being developed • Software required • BURS. Will be supplied to interested parties • ENVI. To analyse ‘img’ files. (www.rsi.com)
Overview of Demonstration • Data planning • Data capture • Data calibration • Conversion of data to ENVI format • Automation of data capturing • Overview of analysis system
Overview of Practical • Fuego eruption in January 2004 • Analysis of data for thermal activity • Use of ENVI • Data for 27th December 2003, 6th, 9th and 12th January 2004 • Outputting data to images and ASCII format • Demo of analysis system for images for 8th and 9th January • Time series of Thermal activity