Download
1 / 51
550 likes | 927 Views
Measures of Variability. Overheads 4. Quiz: Week 4 Understanding Check. The quiz is located under “Course Materials” You may want to stop the video and complete the quiz now. You are NOT required to submit this quiz. Quiz: Question 1. 1. What is the independent variable in Problem 1?

E N D
Measures of Variability Overheads 4
Quiz:Week 4 Understanding Check The quiz is located under “Course Materials” You may want to stop the video and complete the quiz now. You are NOT required to submit this quiz.
Quiz: Question 1 1. What is the independent variable in Problem 1? • Type A and B Blood • Survival Rate • 80% chance of survival • Blood Type
Quiz: Question 2 2. What is the dependent variable in Problem 1? • Blood Type • Survival Rate • 80% chance of survival • Type A and B Blood
Quiz: Question 3 3. Which of the following would be most appropriately measured on an ordinal scale? • Type of Religion (Catholic, Protestant, Jewish…) • Gender (Male, Female) • Academic Ranking (Freshman, Sophomore, Junior, Senior) • Hair Color (Blonde, Brunette, Redhead…)
Quiz: Question 4 4. For Data 1, what is the mode of Group 1? • 3.00 • 4.00 • 5.00 • 6.00
Quiz: Question 5 4. For Data 1, what is the median of the entire data set? • 3.00 • 4.00 • 5.00 • 6.00
Quiz: Question 6 4. What is the mean of Group 2? • 3.40 • 4.60 • 4.00 • 5.00
Quiz: Question 7 7. What is the value of this symbol for Data 1? • 40.00 • 10.00 • 18.00 • 8.00
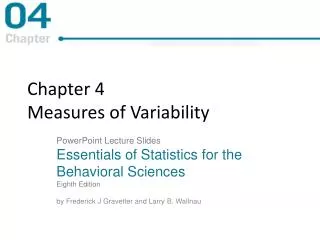
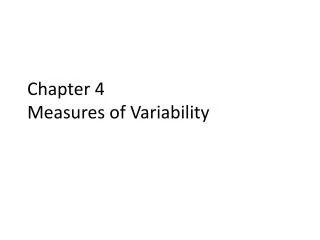
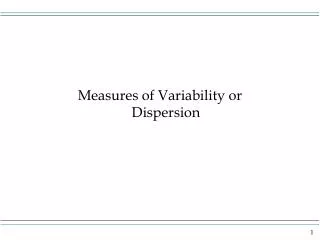
Measures of Variability • How do we best describe the spread or dispersion of the scores in our distribution? • It depends on which measure of central tendency we consider. • Measures of Variability, some examples • For the Mode: Range • For the Median: Interquartile Range • For the Mean: Variance or Standard deviation
X Figure 1
X Figure 2
X Figure 3
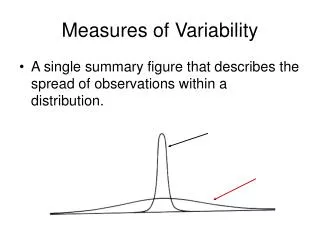
Mathematical Measures of Variability • Nominal data: Range • X(max) – (X(min) • The best we can do to describe spread around a mode. • Notice, only two scores go into the calculation of the range. • Ordinal data: (Semi-) Interquartile range • Only takes the location of the scores (top half/bottom half) into account, not the value of the scores. Interquartile range Semi-interquartile range
Figure 4: Interquartile Range 25% 25% Q1 Q2 Q3
Mathematical Measures of Variability • Nominal data: Range • X(max) – (X(min) • The best we can do to describe spread around a mode. • Notice, only two scores go into the calculation of the range. • Ordinal data: (Semi-) Interquartile range • Only takes the location of the scores (top half/bottom half) into account, not the value of the scores. Interquartile range Semi-interquartile range
Figure 5: Semi-Interquartile Range 25% 25% Q1 Q2 Q3
Q1 Q2 Q3 Normal Distribution Q3 – Q2 =Q2 – Q1
Negatively Skewed Distribution Q3 – Q2 <Q2 – Q1 - + Q1 Q2 Q3
Positively Skewed Distribution Q3 – Q2 >Q2 – Q1 - + Q1 Q2 Q3
Deviation Scores • A deviation score is a measure of how far away from the mean each score falls. • The farther away a score is (meaning that it is in the tails of the distribution) the larger its deviation score. • If you added up all of the deviation scores they would equal zero. • This only happens when you calculate deviations around the mean.
The Mean Sample Mean Population Mean
Deviation Scores • A deviation score is a measure of how far away from the mean each score falls. • The farther away a score is (meaning that it is in the tails of the distribution) the larger its deviation score. • If you added up all of the deviation scores they would equal zero. • This only happens when you calculate deviations around the mean.
Deviation Scores x1 = +5.00 x2 = - 2.00 X2 X1
Squared deviation scores. • Since the deviation scores always add up to 0.00, then it doesn’t make sense to average them (since that would only give you 0.00/N). • So…instead we square the deviation scores before taking the average of the deviation scores. • This value is called the sums of squares.
Step 1 X x Raw Deviation Score Score
Step 2 X x x2 Raw Deviation Squared Score Score Deviation Score
Step 3 X x x2 Raw Deviation Squared Sum of Score Score Deviation Squared Score Deviation Scores
Formulas 2 Sum of the Sum of the Sum of the Squared Squared Scores Deviation Scores Scores Squared (Sum of Squares)
Least squares criterion. • We already said that one property about the mean is that the sum of the deviation scores around the mean is equal to zero. • The other property of the mean is the least squares criterion. • If you square all of the deviation scores around the mean and add them together you will get a smaller value than if you did the same thing about any other number in a distribution (e.g., the median, the model).
Variance • Variance of a population is the average of the squared deviations around the population mean (mu). Sum of Squared Deviations (Sums of Squares) Sample size
Calculations using the definitional formula for a population. (σ2) • After you calculate the squared deviations and you add then together (the sums of squares) then you divide that value by your sample size.
Variance side note: Bias • Variance for a population, σ2 • Variance for a sample, s2 : This adjustment is made because the sample produces a “biased” estimate of the population value
Calculations using the definitional formula for a sample variance (s2). • After you calculate the squared deviations and you add then together (the sums of squares) then you divide that value by your sample size.
Standard Deviation • Standard deviations are difficulty to interpret since they are usually utilized as a mathematically pleasing measure of variability. • Simply the square root of the variance. • They are useful for some inferences we will make later using the normal curve and probabilities. Population Standard Deviation Sample Standard Deviation
Definitional vs Computational • Definitional Formula • Population • Definitional Formula • Sample • Computational Formula • Population • Computational Formula • Sample
Visual Displays and Variability • We want graphs or plots that can show us how spread out our data are. • If scores are VERY spread out, then there is a lot of diversity amongst the individuals of our population (sample). • If this is true, then using a measure of central tendency
What does Variability look like? • We use various graphical displays to examine the variability of the scores • Frequencies of continuous variables • Histogram • Stem-and-leaf • Grouped data • Boxplots (Box and whisker plots) • Bar charts, pie charts, etc.
In-Class Problem Set & Solution Located under “Course Materials”
Writing a Results Section For the online course you are not required to write a Results section