Download
1 / 18
180 likes | 189 Views
Current and Future Use of Satellite Data in NWP at Environment Canada. Satellite Direct Readout Conference 2011 Miami, USA David Bradley, Gilles Verner, Mike Manore Meteorological Service of Canada April 4-8, 2011. Context. Environment Canada (EC) Meteorological Services of Canada (MSC)

E N D
Current and Future Use of Satellite Data in NWP at Environment Canada Satellite Direct Readout Conference 2011 Miami, USA David Bradley, Gilles Verner, Mike Manore Meteorological Service of Canada April 4-8, 2011
Context Environment Canada (EC) Meteorological Services of Canada (MSC) “providingweather and environmental predictions and services to reduce risks and contribute to the well-being of Canadians” • Operations (e.g. 24-7 forecasts and warnings, NWP operations) • Monitoring Networks (e.g. Upper Air, Surface, Climate, Water, Space-based) • Environmental Predictions and Services (e.g. Ice, Aviation, Military, Policy) • Science (e.g. Air Quality, Climate, Meteorological)
Canadian Meteorological Centre (CMC) Meteorological Research Division: Data Assimilation, Modeling, Cloud Physics CMC Development Division: Data Assimilation, Numerical Weather Prediction, Weather Elements, Scientific Applications IT Infrastructure (CIOB): Supercomputer, National Telecommunications, Network, User support CMC Operations: Analysis & Prognosis, Env. Emergency Response (VAAC), Air Quality, Implementation and Operational Services
Role of CMC and Regions in Weather Prediction Tech. transfer MRD Research in NWP, Data Assimilation, Remote Sensing and AQ 5 EC Regions Canadian Data USERS Warnings Forecasts Dissemination Services Data + Prod. NAV CANADA Dept. NationalDefence Public Marine Agriculture Private sector . . . CMC Supercomputer/Telecom Decoding, QC & Databasing Data Assimilation & Modeling Post-processing Canadian Ice Service International Data (GTS Washington, NESDIS, Eumetsat, UKMet, etc.) Aviation & Defense Services
THE MAKING OF A WEATHER FORECAST • Observations obtained from weather balloons, surface stations, ships, satellites, aircrafts, drifting buoys. • Produce Values of atmospheric variables (temperature, winds, humidity & pressure) at mesh points. • Run computer model of atmosphere. Provides forecast values of atmospheric variables at mesh points. • Applications. Forecasts interpreted in terms of weather elements (e.g. sunny and cloudy periods), disseminated via media. DATA ACQUISITION COMPUTER ANALYSIS OF DATA COMPUTER FORECAST INTERPRETATION & DISSEMINATION
Data Assimilation Process Use J(xi-1) to find xi Data Acquisition Error Statistics (Observation and Forecast) Data Quality Control Analysis (Spatial QC) Cost First Guess (6hr fcst) xa MIN J(x) NWP model
Main Uses of Observational Data at CMC • CMC is a major user of observational data, both Canadian and foreign, main uses are: • Data Assimilation: Blending of observations with other information to generate initial conditions (the analysis) to run the NWP forecast models. Radiosonde andSatellite data are of crucial importance. • Forecast Verification: Observations (upper air, surface, satellite) considered as truth (after QC), and used to verify the accuracy of forecasts (both model and Scribe) and perform diagnostic studies. • Weather Element Forecast: Observations used in generation of statistical equations which are used to produce forecasts of weather elements, important input to SCRIBE and forecast system. • Applications: EER (volcanic ash, spills, fires, etc.), air pollution and atmospheric chemistry, nowcasting, surface fields (SST, ice, snow, etc.)
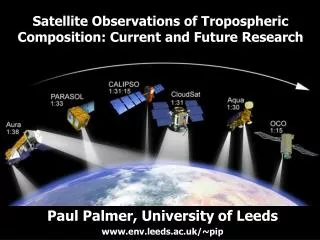
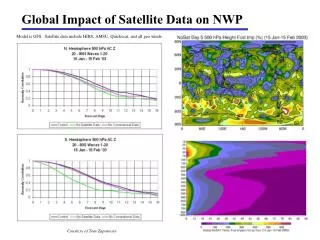
Observing Systems used in Global DA Geostationary Satellites (GOES-11,12, Meteosat-7,9; MTSAT-1R) Polar-orbiting Satellites (NOAA-15,16,17,18,METOP-A; DMSP-F15; AQUA, TERRA;) Aircraft (BUFR, AIREP, AMDAR, ADS) Wind profilers (NOAA network) Buoys and ships Upper-air sites (TEMP, PILOT, DROP) Surface stations (SYNOP, ASYNOP,METAR)
Observations assimilated at CMC Type Variables Thinning Radiosonde/dropsonde U, V, T, (T-Td), ps 28 levels Surface report (SYNOP, SHIP, BUOYs) T, (T-Td), ps, (U, V over water) 1 report / 6h Aircraft (BUFR, AIREP, AMDAR, ADS) 1o x 1o x 50 hPa per time step U, V, T ATOVS NOAA 15-16-17-18-19, AQUA, METOP 250 km x 250 km per time step Ocean Land AMSU-A 4-14 6-14 AMSU-B / MHS 2-5 3-4 IM3 (6.7 µm) 2o x 2o 3-hourly Water vapor channel GOES 11-12 AIRS 87 IR channels 250kmx250km/time step QUIKSCAT, ASCAT U,V at 10 meter over ocean 100kmx100km/time step 7 MW channels 200kmx200km/time step SSM/IDMSP-13 AMV’s (METEOSAT E-W, GOES E-W, MTSAT-1R) U,V (IR, WV, VI, 3.9μ channels) 1.5o x 1.5o 11 layers, per time step MODIS polar winds (Aqua, Terra, Global & DB) U,V ~180 km boxes 11 layers, per time step Profiler (NOAA Network) U,V (750 m) Vertical hourly GPSRO (COSMIC, GRACE, GRAS) Refractivity 830km, per time step
Conventional Observations Surface reports Radiosondes Aircraft reports
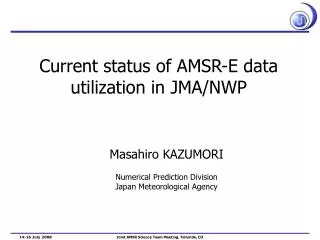
Passive remote sensing observations (polar-orbiting satellites) AIRS AMSU-A/B SSM/I
Passive remote sensing observations AMVs GOES radiances
Active remote sensing observations GPS-RO Scatterometers Wind profilers
Data Quality Monitoring • Meteorological Centres such as CMC that run Numerical Weather Prediction (NWP) models can monitor the performance of instruments (e.g. aircraft sensors used in AMDAR) on a continuous and near real-time basis • Monitoring is based on observed minus first guess values (innovations), as well as data rejection statistics, extracted from the operational data assimilation system • Monitoring is performed for individual platform, station, as well as by various programs (e.g. E-AMDAR, NOAA Satellites, etc). • Time evolution of innovations, as well as their statistical distribution are extremely powerful and useful tools
Analysis & Prediction at CMC • Environmental Emergency applications – dispersion modeling • Nuclear and volcanic ash • Release of hazardous chemicals • National security issues
Challenges • Data Access • Despite numerous dissemination channels • Unique solutions for each new observation/product • Data Timeliness • Require data less than one hour old • Weather Waits For No Man .. or Satellite .. or Data Delivery System • Maintaining a Super-Computer facility • Many modeling programs require access • Keeping up with computing advances • Assimilation of new data • Takes a long time to assimilate new data • Human resources - Finding, hiring and keeping operational staff, researchers etc.