Download
1 / 20
210 likes | 393 Views
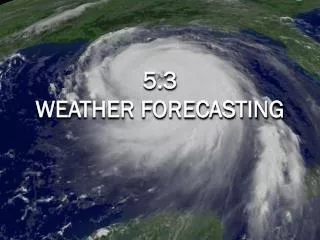
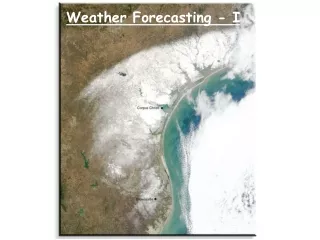
Weather Forecasting. The National Weather Service counts on two sources for information:. Data collected from the atmosphere Data collected from the Earth’s surface . Weather Balloon. Radar. In order to forecast the weather, meteorologists make measurements of:. temperature winds

E N D
The National Weather Service counts on two sources for information: • Data collected from the atmosphere • Data collected from the Earth’s surface Weather Balloon Radar
In order to forecast the weather, meteorologists make measurements of: • temperature • winds • air pressure • humidity • precipitation
Instruments used to measure precipitation: Snow Gauge Rain Gauge
Instrument used to measure temperature: Thermometers
Instrument used to measure humidity: Psychrometer
Instrument used to measure wind speed Anemometer
Instrument used to measure air pressure: Barometer
When meteorologists gather up data, it is recorded on a map using a combination of symbols, forming a STATION MODEL.
Isobars are lines that connect equal atmospheric pressure . These lines show the areas of high and low pressure.
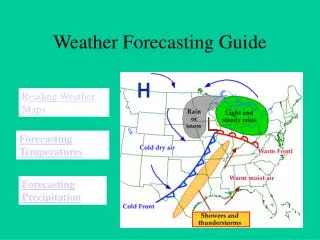
Pressure Changes with Temperature Warm, less dense air rises forming clouds L Cold, dense air sinks to the surface of the Earth. Air flows in a clock-wise direction on the surface of the Earth. Airs flows in a counter clock-wise direction at the surface of the Earth.
Pressure Gradients • There are many areas of high and low pressure above the Earth’s surface due to uneven surface heating creating pressure gradients.
The closer the isobars, the stronger, the winds blow. • The more spread out the isobars, the gentler the winds.
High Pressure H Low Pressure L Warm Front Which direction is the warm front moving? What will happen to the weather in Denton? 25°C 28°C H 40°C 29°C L 45°C Occluded Front Cold Front Stationary Front
STATION MODEL is created when data that is collected is recorded on a map using a combination of symbols. Symbols for Fronts Isobars are lines that connect equal atmospheric pressure . The closer the isobars, the stronger the winds blow. The more spread out the isobars the gentler the winds. L There are many areas of high and low pressure above the Earth’s surface due to uneven surface heating creating pressure gradients. Warm, less dense air rises forming clouds Cold, dense air sinks to the surface of the Earth. Air moves from high pressure to low pressure forming winds. Air flows in a clock-wise direction on the surface of the Earth. Cold, dense air sinks to the surface of the Earth forming. Warm, less dense air rises forming clouds Airs flows in a counter clock-wise direction at the surface of the Earth. Air flows in a clock-wise direction on the surface of the Earth in High Pressure areas. Airs flows in a counter clock-wise direction at the surface of the Earth in Low Pressure areas.