Download
1 / 1
10 likes | 98 Views
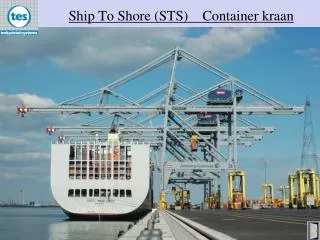
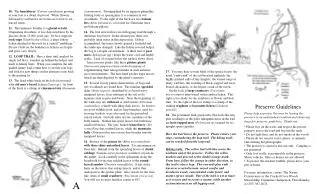
incoming solar. southeast looking. southwest looking. Wadden Sea. North Sea. southwest looking. 13:00 UTC. 12:30 UTC. 09:00 UTC. Rain radar. southeast looking. 09:00 UTC. 13:00 UTC. 12:30 UTC. GUIDELINES FOR (SHIP BORNE) AUTO-MONITORING OF COASTAL AND OCEAN COLOR.

E N D
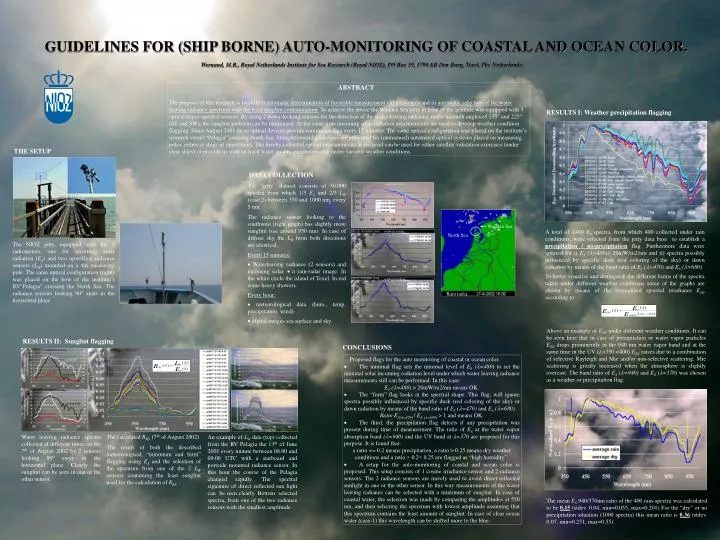
incoming solar southeast looking southwest looking Wadden Sea North Sea southwest looking 13:00 UTC 12:30 UTC 09:00 UTC Rain radar southeast looking 09:00 UTC 13:00 UTC 12:30 UTC • GUIDELINES FOR (SHIP BORNE) AUTO-MONITORING OF COASTAL AND OCEAN COLOR. • Wernand, M.R., Royal Netherlands Institute for Sea Research (Royal NIOZ), PO Box 59, 1790 AB Den Burg, Texel, The Netherlands; • ABSTRACT • The purpose of this research is twofold i) automatic determination of favorable measurement circumstances and ii) automatic selection of the water leaving radiance spectrum withthe least sunglint contamination. To achieve the above the Wadden Sea jetty in front of the institute was equipped with 3 optical hyper-spectral sensors. By using 2 down-looking sensors for the detection of the water-leaving radiance, under azimuth angles of 135° and 225° (SE and SW), the sunglint problem can be minimized. At the same time incoming solar radiation measurements are used to develop weather condition flagging. Since August 2001 these optical devices provide continuous data every 15 minutes. The same optical configuration was placed on the institute’s research vessel “Pelagia” crossing North Sea. Straightforward guidelines are presented for (unmanned) automated optical systems placed on measuring poles, jetties or ships of opportunity. The hereby collected optical measurements at sea level can be used for either satellite validation exercises (under clear skies) or provide us with on track water quality parameters also under variable weather conditions. RESULTS I: Weather precipitation flagging THE SETUP DATA COLLECTION The “jetty” dataset consists of 30.000 spectra from which 1/3 ES and 2/3 LW (case 2) between 350 and 1000 nm, every 5 nm. The radiance sensor looking to the southwest (right graph) has slightly more sunglint (see around 950 nm). In case of diffuse sky the LW from both directions are identical. A total of 1400 ES spectra, from which 400 collected under rain conditions, were selected from the jetty data base to establish a precipitation / no-precipitation flag. Furthermore data were ignored for i) ES(=480)< 20mW/m2/nm and ii) spectra possibly influenced by specific dusk (red coloring of the sky) or dawn radiation by means of the band ratio of ES (=470) and ES (=680). To better visualize and distinguish the different forms of the spectra taken under different weather conditions some of the graphs are shown by means of the normalized spectral irradiance ESN according to: The NIOZ jetty, equipped with the 3 radiometers, one for incoming solar radiation (ES) and two upwelling radiance sensors (LW) mounted on a 4m measuring pole. The same optical configuration (right) was placed on the bow of the institute’s RV“Pelagia” crossing the North Sea. The radiance sensors looking 90° apart in the horizontal plane. Every 15 minutes: Waterleaving radiance (2 sensors) and incoming solar. a rain-radar image. In the white circle the island of Texel. In red some heavy showers. Every hour: meteorological data (hum., temp, precipitation, wind) digital images sea surface and sky Above an example of ESN under different weather conditions. It can be seen here that in case of precipitation or water vapor particles ESNdrops prominently in the 940 nm water vapor band and at the same time in the UV (>350 <400) ESN raises due to a combination of selective Rayleigh and Mie and/or non-selective scattering. Mie scattering is greatly increased when the atmosphere is slightly overcast. The band ratio of ES (=940) and ES (=370) was chosen as a weather or precipitation flag. RESULTS II: Sunglint flagging CONCLUSIONS • Proposed flags for the auto monitoring of coastal or ocean color. • The minimal flag sets the minimal level of ES(=480) to set the minimal solar incoming radiation level under which water leaving radiance measurements still can be performed. In this case: • ES(=480) > 20mW/m2/nm means OK. • The “form” flag looks at the spectral shape. This flag, will ignore spectra possibly influenced by specific dusk (red coloring of the sky) or dawn radiation by means of the band ratio of ES (=470) and ES (=680). • Ratio ES(=470) / ES(=680) > 1 and means OK. • The third, the precipitation flag detects if any precipitation was present during time of measurement. The ratio of ES at the water vapor absorption band (=940) and the UV band at =370 are proposed for this purpose. It is found that: • a ratio <= 0.2 means precipitation, a ratio > 0.25 means dry weather conditions and a ratio > 0.2< 0.25 are flagged as “high humidity”. • A setup for the auto-monitoring of coastal and ocean color is proposed. This setup consists of 1 cosine irradiance sensor and 2 radiance sensors. The 2 radiance sensors are merely used to avoid direct reflected sunlight in one or the other sensor. In this way measurements of the water leaving radiance can be selected with a minimum of sunglint. In case of coastal water, the selection was made by comparing the amplitudes at 550 nm, and then selecting the spectrum with lowest amplitude assuming that this spectrum contains the least amount of sunglint. In case of clear ocean water (case-1) this wavelength can be shifted more to the blue. Water leaving radiance spectra collected at different times on the 7th of August 2002 by 2 sensors looking 900 away in the horizontal plane. Clearly the sunglint can be seen in one or the other sensor. The calculated RRS. (7th of August 2002) The result of both the described meteorological, “minimum and form” flagging using ESand the selection of the spectrum from one of the 2 LW sensors containing the least sunglint used for the calculation of RRS. . An example of LW data (top) collected from the RV Pelagia the 13th of June 2001 every minute between 08.00 and 09.00 UTC with a starboard and portside mounted radiance sensor. In this hour the course of the Pelagia changed rapidly. The spectral signature of direct reflected sun light can be seen clearly. Bottom: selected spectra, from one of the two radiance sensors with the smallest amplitude. Themean ES 940/370nm ratio of the 400 rain-spectra was calculated to be 0.15 (stdev. 0.04, min=0.055, max=0.201) For the “dry” or no precipitation situation (1000 spectra) this mean ratio is 0.36 (stdev. 0.07, min=0.251, max=0.55).