Download

1 / 14
180 likes | 423 Views
Experiences and practices on State Estimation in RTE (French Transmission System Operator) Patrick Panciatici (RTE), Yacine Hassaine (RTE). Presentation of SE in RTE.

E N D
Experiences and practices on State Estimation in RTE (French Transmission System Operator)Patrick Panciatici (RTE), Yacine Hassaine (RTE)
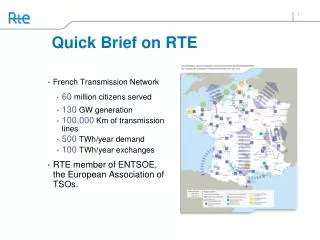
Presentation of SE in RTE • RTE operates the whole French transmission system : (400kV to 63kV, 2500 substations, 100300 km of circuits and 1150 transformers), 7 regional control centers and 1 National • State Estimation provides input for all network’s analysis • Measurements are received every 10 s. • An event is sent, when the status of a switching device changes. • Which kind of measurements ? • Active and reactive power flows on branches, • Active and reactive powers on load and generators, • Voltage magnitudes in substation on busbars, • Internal substation current measurements and tap positions are not transmitted. State Estimation Measurements, Topology Electrical characteristics Coherent state 2008 IEEE PES General Meeting: Panel on Best Practices in State Estimation,
Presentation of SE in RTE Network modeling : • National level : • SE runs every 5mn • 400 kV and 225 kV • A part of external surrounding networks is represented in details ( size around 1200 nodes) • Regional level (7): • SE runs every 10mn • From 63 kV to 400 kV • A part of external surrounding networks is represented in details. (average size around 1000 nodes) Equivalent networks National or Regional network Surrounding networks 2008 IEEE PES General Meeting: Panel on Best Practices in State Estimation,
t Presentation of SE in RTE Inconsistent Snapshot Snapshot Generation : Consistency between topology and measurements A new status may arrive before measurements affected by the switching, this could lead to an incoherent state between topology and measurements and to a problem in state estimation. To minimize the probability of occurrence of this problem, we apply a very important and classical rule to generate a snapshot • We wait 20s to generate a snapshot after the reception of the last switching device status. • A snapshot is generated after 1mn even if the condition isn’t fulfilled Measurements (t) Measurements (t+10) t+10 switching 2008 IEEE PES General Meeting: Panel on Best Practices in State Estimation,
Presentation of SE in RTE Observability : • A numerical observability is used, with a decoupled Jacobian matrix. • better numerical robustness in SE • Critical pseudo-measurements are added in unobservable areas to restore observability. • no effect on estimated states • The EHV network is more observable than HV network. • pair measurement s ( P,Q) in EHV sometimes not in HV • The percentage of observable nodes varies from 80% to 92%. 2008 IEEE PES General Meeting: Panel on Best Practices in State Estimation,
Presentation of SE in RTE • Computing algorithms : • For real time : A classical L2 cost function is minimized using Gauss-Newton algorithm • For off line data validation : A M-estimation function is minimized using a trust region method based on Luvember-Marquardt algorithm. • Estimation of OLTC taps, there are two steps : • First step : ratios of transformers are considered as continuous variables • Second step : ratios are fixed to the nearest discrete value • For each node, the estimated nodal injection is dispatched among loads and generators • Maximum values are taken into account • If the estimated nodal injection is greater than the total of maximum values, a fictitious load is created to balance the system. 2008 IEEE PES General Meeting: Panel on Best Practices in State Estimation,
Presentation of SE in RTE • Bad data detection : • Detection of bad data is based on a 2 test. • If 2 test fails, we use normalized residuals to detect bad data • an iterative process deletes one by one bad data and reruns a SE (maximum 10 iterations) • This approach suppose that only measurement may be contaminated by bad data. This hypothesis is not always satisfied, in this case robust state estimation helps to find the problem. We define two kind of robustness: • Numerical robustness, it deals with the reduction of divergence • Trust region method • Bad data robustness, which reduce the bad data effect. • M-estimator rather L2 estimator 2008 IEEE PES General Meeting: Panel on Best Practices in State Estimation,
Presentation of SE in RTE • Visualization • The same tool in : • Real time • Study mode. • we can load a snapshot (green : observable, red : unobservable) • For each substation, a comparison is possible between : • Estimated state • Measured state Figure : The EHV network of RTE (study mode) 2008 IEEE PES General Meeting: Panel on Best Practices in State Estimation,
Presentation of SE in RTE • Visualization : Figure 2 : 400kV substation , measured state Figure 3 : 400kV substation , estimated state 2008 IEEE PES General Meeting: Panel on Best Practices in State Estimation,
Use of SE in RTE • Real time operations : • State estimation builds a coherent state before any contingency analysis. • Building of reference base cases : • From 2 to 4 reference cases per day are built, which are used to build forecast cases for operational planning , for ATC computation, … . • We developed a collaborative process between our 7 regional control centers and our national control center 2008 IEEE PES General Meeting: Panel on Best Practices in State Estimation,
Building of reference base cases : principles • Initialization by National Control Center … Import snapshot of Region 1 EHV-HV Import snapshot of Region 7 EHV-HV • Merging of 7 regional snapshots (EHV-HV) …. Export state of Region 1 EHV(National)-HV(regional) Export state of Region 7 EHV(National)-HV(regional) …. manual validation (Region 7) manual validation (Region 1) • Merging of 7 regional corrected states (EHV-HV) Final manual validation by NCC (EHV-HV) Export final corrected state of Region 1 EHV(National)-HV(regional) Export final corrected state of Region 7 EHV(National)-HV(regional) 2008 IEEE PES General Meeting: Panel on Best Practices in State Estimation,
Manual Validation based on quality criteria • SE quality criteria : • Number of iterations or divergence • Number of unobservable nodes • Rate of redundancy • Number of fictitious loads • Possible inconsistencies between topology and measurements • Number of critical measurements • Number of bad data • A change of one these criteria requires an analysis • A global quality index based on these criteria is given to each reference base case. 2008 IEEE PES General Meeting: Panel on Best Practices in State Estimation,
Building of reference base cases : Work Flow monitoring 2008 IEEE PES General Meeting: Panel on Best Practices in State Estimation,
Most important challenges • We need to have more coordination between European TSOs, an European network model is mandatory Hierarchical SE. • The robustness of state estimation : • Still a challenging subject • No substation internal measurements transmitted => difficult to detect an error on topology • A state estimation running at the substation level could improve the situation. • Ensuring the consistency between topology and measurements, full coherent state transmitted (status of switching devices and measurements for example each 1 sec.). • To improve the measurement system, the worst stage must be improved first. • In our case the first limiting factor is the LAN at substation level ( old protocol using 8 bits for measurements). • Calibration of CVT, … 2008 IEEE PES General Meeting: Panel on Best Practices in State Estimation,