Download

1 / 50
500 likes | 631 Views
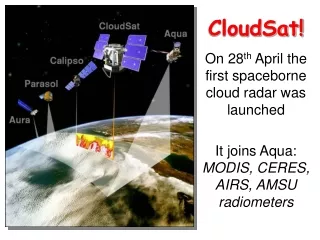
CloudSat views the Asian summer monsoon an opportunistic data celebration. Brian Mapes University of Miami. CloudSat. 3 mm wavelength radar, nadir pointing Sees cloud and precipitation attenuation in heavy rain 5 mm/h obscures surface Nadir “curtain” sampling

E N D
CloudSat views the Asian summer monsoonan opportunistic data celebration Brian Mapes University of Miami
CloudSat • 3 mm wavelength radar, nadir pointing • Sees cloud and precipitation • attenuation in heavy rain • 5 mm/h obscures surface • Nadir “curtain” sampling • Vertical (range) sampling 250m • Horizontal (along track) sampling 1.1 km • Twice daily (1am, 1pm local time) • Flying since June 2006 • here examine JJAS 2006 data in Asian region
CloudSat and the A-Train CloudSat measurements within a few minutes of all other A-train observations
spotty / sparse sampling (nadir ‘curtain’ only) 1pm and 1am LST only radar reflectivity is a hard to interpret physical measurement Attenuation; surface clutter issues at low levels Encourages unbiased (whole dataset !) analysis Part of the A-train Rich in information - accurate, large dynamic range - retrievals will come FIRST global profiles !!! Cloud top is best meas. Cloud tops >1km are fine. Opportunism
CloudSat – Measured Return Power Cloud Mask (20-40 = “yes”) cloud
This analysis based on cloud objects • A contiguous region (in the vertical slice) where cloud mask = “yes” • Each has a bundle of attributes • mean lat, mean lon, time, top, thickness, width, lowest and highest altitude of surface underneath, etc. etc. • Each is collection of pixels (3-1000’s of them) • accessible using cloud ID # • example (a complicated one): top thk = NPIX/width width
First condsider all JJAS 2006 clouds centered in 10-15N, 75-80E All JJAS 2006 cloud centroids
1 Deep (High Thick) 0 High thin 2 middle thin 3 mid-top Thick 4 low thin Define 7 tropical cloud object types • Joint histogram of top height & thickness • First: all clouds 15N-15S (as a global backdrop) Low top but tall/thick or drizzling (5: >10km wide) (6: <10km wide)
JJAS 2006 day and night clouds over S. India~ true aspect ratio 20 km layers
One night cloud 350 km wide day night
Jointhistograms of pixel-wise z & dBZpos. anomalies(mean histogram & more later) low-dBZ high clouds low-dBZ low clouds high-dbZ (and raining) middle clouds
Beyond South India • ASM pattern & profile of cloud objects by cloud top altitude • Natural cloud “types” • Drill down to pixels (z - dBZ joint hists.) • Contrasts • ocean - coast - land • lowland - slope - plateau (over E & W Tibet) • day - night • East Asia vs. South Asia (Bin Wang request) • Dynamical variations • MISO from Sep. 2006
JJAS OLR climatology 7 8 9 3 4 5 6 1 2 0
7 8 9 3 4 5 6 1 2 0 JJAS 2006 CloudSat-sampled cloudvolume
7,8,9 Tibet, E.Asia 1,2 (Eq.) 3,4,5,6 (NIO, SCS, Phil.) 0 (SH) Latitude vs. top-height distributionwhole monsoon (40E-160E) tropical deep plateau, midlat. midlat. middle tops low-top clouds in subtropics
Lon vs. cloudtop distribution JJAS 2006 CloudSat-sampled cover (area) (S Asia: middle-topped clouds enhanced) 7 8 9 3 4 5 6 1 2 0
Beyond South India • ASM pattern & profile of cloud objects by cloud object top altitude • Natural cloud “types” • Drill down to pixels (z - dBZ joint hists.) • Contrasts • ocean - coast - land • lowland - slope - plateau (over E & W Tibet) • day - night • Dynamical variations • MISO from Sep. 2006
1 Deep (High Thick) 0 High thin 2 middle thin 3 mid-top Thick 4 low thin Joint histogram of top height & thickness • First: all clouds 15N-15S, Jun06 - Feb07 • (as a global backdrop) Low top but tall/thick or drizzling (5: >10km wide) (6: <10km wide)
1 Deep (High Thick) 0 High thin 2 middle thin 3 mid-top Thick 4 low thin Define 7 tropical cloud object types • Joint histogram of top height & thickness • First: all clouds 15N-15S (as a global backdrop) Low top but tall/thick or drizzling (5: >10km wide) (6: <10km wide)
0C well above melting level... Midlevel clouds: a bimodal populationin global tropics 5-6 km 7-8 km
Monsoon cloud object types • Joint histogram of top height & thickness • All 10 monsoon regions pooled, JJAS 1-Deep 0-High layers 2-Middle layers 3-Mid-top towers 4-Low layers Low top but tall/thick or drizzling (5: >10km wide) (6: <10km wide)
Monsoon cloud object types • Joint histogram of top height & thickness • All 10 monsoon regions pooled, JJAS 1-Deep 0-High layers 2-Middle layers 3-Mid-top towers 4-Low layers Low top but tall/thick or drizzling (5: >10km wide) (6: <10km wide)
7 8 9 3 4 5 6 1 2 0 9 7 8 Cloud volume by cloud type 2 times of day Land only (E. India) (W. India) 6 5 3 4 (W. India) 2 1 am Deep convection 1 1pm 0
Beyond South India • ASM pattern & profile of cloud objects by cloud object top altitude • Natural cloud object “types” • Drill down to pixels (z - dBZ joint hists.) • Contrasts • ocean - coast - land • lowland - slope - plateau (over E & W Tibet) • day - night • Dynamical variations • MISO from Sep. 2006
Joint histogram of dBZ and zall pixels in all JJAS 2006 monsoon clouds Most frequent cloud: -25 dBZ at 13 km tropopause (a true Earth phenomenon) z (km) sensitivity (instrumental) Minimum of frequency in middle of measurement space rain atten. multiple scat. (instrumental) clutter (instrumental) Reflectivity (dBZe)
Histogram enhancements associated with pixels in each of the 7 cloud types Hightop-thick Hightop-thin Heavy rain attenuates Lowtop-thin Midtop-thick Midtop-thin rain Low-thick-narrow Colors show positive anomalies (relative to all-monsoon cloud pool) of normalized probability density Low-thick-wide rain rain
Beyond South India • ASM pattern & profile of cloud objects by cloud object top altitude • Natural cloud object “types” • Drill down to pixels (z - dBZ joint hists.) • Contrasts • geographic boxes • ocean - coast - land • day - night • Dynamical variations • MISO from Sep. 2006
7 8 9 3 4 5 6 1 2 0 open contours all-monsoon mean Joint Histograms for boxes
7 8 9 3 4 5 6 1 2 0 open contours = all-monsoon mean colors = enhanced normalized frequency Normalized PD Anomalies >0
sea-coast-land in monsoon tropics (zones 1-6) Sea Coast Land
Recall --South India box low-dBZ high clouds low-dBZ low clouds high-dbZ (and raining) middle clouds
All day and night clouds over S. India 20 km layers
East Asia(hT type, sea, nite)Bin Wang special requestBoB(hT type, sea, nite) “more frontal”? “more convective”?
Beyond South India • ASM pattern & profile of cloud objects by cloud object top altitude • Natural cloud object “types” • Drill down to pixels (z - dBZ joint hists.) • Contrasts • geographic boxes • day - night • Dynamical variations • MISO from Sep. 2006 • compare to BoB Onset 1999 (JASMINE)
Clouds in a monsoon ISO define a fixed grid on 60-90E OLR time-lat section 1 mo front after Sep. 2006
Clouds in frontsorted by top heighttrue aspect ratio front: 581 clouds, 614954 pixels
Clouds in after category sorted by top height after: 296 clouds, 106883 pixels cf. front: 581 clouds, 614744 pixels
Front vs. After • Normalized joint histograms of dBZ and z of pixels (log color scale)
sen atten sen atten cf. shipborne CPRMay 1999JASMINEBay of Bengalcourtesy P. Zuidema active pre-onset
sum joint histograms for each MISO phase over dBZ dimension =>Cloud fraction profiles across MISO Cloud Fraction after front MISO-relative time (3.5 day bins)
Dynamical data & deductions • ∂/∂t (cloud volume) ∂/∂p (mass flux) ? • CloudSat rad. heating product • ECMWF met. interpolated to each pixel after front MISO-relative time (3.5 day bins)
Findings • CloudSat is good (despite its badnesses) • Cloud object library is a convenient approach • can drill down to pixels as needed • Tropical clouds fall into types (modes of distributions) • Monsoon clouds are diverse • low clouds in SIO • deep convection over tropics • progressively deeper from Arabian Sea -> BoB -> SCS -> Phil. Sea • middle clouds enhanced over S. Asian longitudes • enhanced at night over land, raining • East Asian clouds (cb systems over sea have lower tops) • Sep. 2006 MISO cloud structure is tilted • in an unsurprising manner, but nice to see
Cloud volume distribution in horizontal size vs. top height space (all 15N-15S clouds)
7 8 9 3 4 5 6 1 2 0
One equatorial MJO in our database so far years since 1-1-2006