Download
1 / 33
330 likes | 437 Views
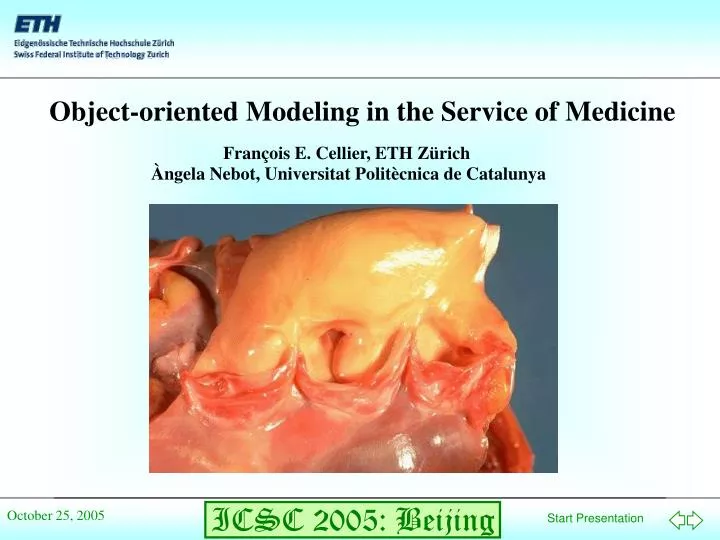
Object-oriented Modeling in the Service of Medicine. Fran çois E. Cellier, ETH Zürich. Àngela Nebot, Universitat Politècnica de Catalunya.

E N D
Object-oriented Modeling in the Service of Medicine François E. Cellier, ETH Zürich Àngela Nebot, Universitat Politècnica de Catalunya
As the systems that are being analyzed by mathematical models have grown in complexity over the years, they have become increasingly difficult to interpret and maintain. System Complexity and theUnderstandability of Models • Modelers need to concern themselves with the understandability and maintainability of their models. • Tools need to be developed that support them in this endeavor.
The object-oriented modeling paradigm enables the modeler to encapsulate knowledge in such a way that snippets of knowledge can be translated to a language familiar to the domain expert. Object-oriented Modeling • The complexity of the models is locally contained by encapsulation and hierarchical composition of models. • Models are being made more easily understandable by exploiting the two-dimensional nature of planar graphics.
Models of subsystems can be encapsulated as graphical objects, called icons. Graphical Modeling • The icons can be topologically interconnected to form a two-dimensional network. • Sub-networks of graphical objects can be grouped together to form new objects, for which icons can be designed. In this way, systems can be hierarchically composed from sub-systems forming a tree. • The leaves of the tree must be described by equations.
Bond graphs are one type of graphical object-oriented models. Bond Graph Modeling • They describe the power flow through a physical system. • Since energy and power flow are common to all types of physical systems, bond graphs are domain independent. • The equation-based leaf models of bond graphs can be pre-coded for all domains.
The modeling of physical systems by means of bond graphs operates on a graphical description of energy flows. The energy flows are represented as directed harpoons. The two adjugate variables, which are responsible for the energy flow, are annotated above (intensive: potential variable, “e”) and below (extensive: flow variable, “f”) the harpoon. The hook of the harpoon always points to the left, and the term “above” refers to the side with the hook. e: Effort f: Flow e P = e · f f The Bond Model
i Se + i 0 0 Energy is being added to the system I Voltage and current have opposite directions 0 v v v u u U v U b a a b I 0 I 0 Sf U 0 Sources in Bond Graph Representation
R i R C I Voltage and current have same directions i i i C i u v v u v v v u u u v u b b a b a a Energy is being taken out off to the system L i Passive Electrical Elements in Bond Graph Representation
e2 e2 e1 = e2 e2 = e3 f1 – f2– f3 = 0 f2 f2 e1 e1 0 1 e3 e3 f1 f1 f3 f3 f1= f2 f2 = f3 e1 – e2– e3= 0 Junctions
v0 = 0 P = v0 · i0 = 0 An Example II
Every bond defines two separate variables, the effort e and the flow f. Consequently, we need two equations to compute values for these two variables. It turns out that it is always possible to compute one of the two variables at each side of the bond. A vertical bar symbolizes the side where the flow is being computed. e f Causal Bond Graphs
The flow has to be computed on the right side. Se i 0 The source computes the effort. U u I 0 Sf The source computes the flow. The causality of the sources is fixed. “Causalization” of the Sources U0 = f(t) I0 = f(t)
I R C R u = R · i i = u/ R i i i i The causality of resistors is free. u u u u du/dt = i / C di/dt = u / I The causality of the storage elements is determined by the desire to use integrators instead of differentiators. “Causalization” of the Passive Elements
e2 e2 e2 = e1 e3 = e1 f1 = f2+ f3 f2 f2 e1 e1 1 0 e3 e3 f1 f1 f3 f3 f2= f1 f3 = f1 e1 = e2+ e3 “Causalization” of the Junctions Junctions of type 0 have only one flow equation, and therefore, they must have exactly one causality bar. Junctions of type 1 have only one effort equation, and therefore, they must have exactly (n-1) causality bars.
U0 .e = f(t) U0 .f = L1 .f + R1 .f dL1 .f /dt = U0 .e / L1 C1.f U0.e U0.f L1.f L1.e R1.e R2.f R1.f C1.e C1.e U0.e U0.e R1.f R1.f C1.e R2.e dC1 .e /dt = C1 .f / C1 C1 .f = R1 .f –R2 .f R2 .f = C1 .e / R2 R1 .e = U0 .e –C1 .e R1 .f = R1 .e / R1 “Causalization” of the Bond Graph e
Beside from the two adjugate variables e and f, there are two additional physical quantities that play an important role in the bond graph methodology: p = e · dt The Four Base Variables of the Bond Graph Methodology Generalized Momentum: q = f · dt Generalized Position:
C I e = R( f ) q = C( e ) p = I( f ) Resistor: Capacity: Inductivity: e f q p R Arbitrarily non-linear functions in 1st and 3rd quadrants There cannot exist other storage elements besides C and I. Relations Between the Base Variables
The hemodynamics describe the flow of blood through the heart and the blood vessels, i.e., the flow of blood through the cardiovascular system. Hemodynamics • The hemodynamics of the human body can be interpreted as a hydromechanical system. Blood is similar to water, blood vessels can be inerpreted as pipes, and the heart chambers act as hydraulic pumps. • Some of the chambers and vessels contain valves that act like check valves, preventing a backflow.
Transporter Model I Icon Window Diagram Window
Transporter Model II Equation window Documentation window
Container Model Icon Window Diagram Window
Valve Model (Transporter) Diagram Window
Heart Chamber (Container) Icon Window Diagram Window
Left Ventricle (Heart Chamber) Diagram Window
The Heart Icon Window Diagram Window
The Thorax Diagram Window
The Cardiovascular System Icon Window
Central Nervous System Control (Qualitative Model) Hemodynamical System (Quantitative Model) TH Heart Rate Controller Heart B2 Regenerate Regenerate Regenerate Regenerate Regenerate Myocardiac Contractility Controller Q4 Peripheric Resistance Controller Circulatory Flow Dynamics D2 Venous Tone Controller Carotid Sinus Blood Pressure Q6 Coronary Resistance Controller PAC Pressure of the arteries in the brain. Recode The Cardiovascular System
Object-oriented graphical modeling has helped us translate a hydro-mechanical model of the cardiovascular system into a representation that medical personnel can interpret and deal with. Summary • The knowledge at each layer was suitably encapsulated for limiting the local complexity to a level that can be represented on a single screen. • No manual translation from the high-level representation to executable simulation code is needed. The graphical model at each level contains all of the model equations at that level and underneath it. Hence the model can be compiled in a fully automated fashion and simulated thereafter.