Download
1 / 11
110 likes | 123 Views
Get the best quality preparations for your class 11 exams with studymate. Our economics sample paper class 11 covers all the topics and helps the students in clearing their concepts and perform well in their exams. Visit https://bit.ly/2mlSjJf

E N D
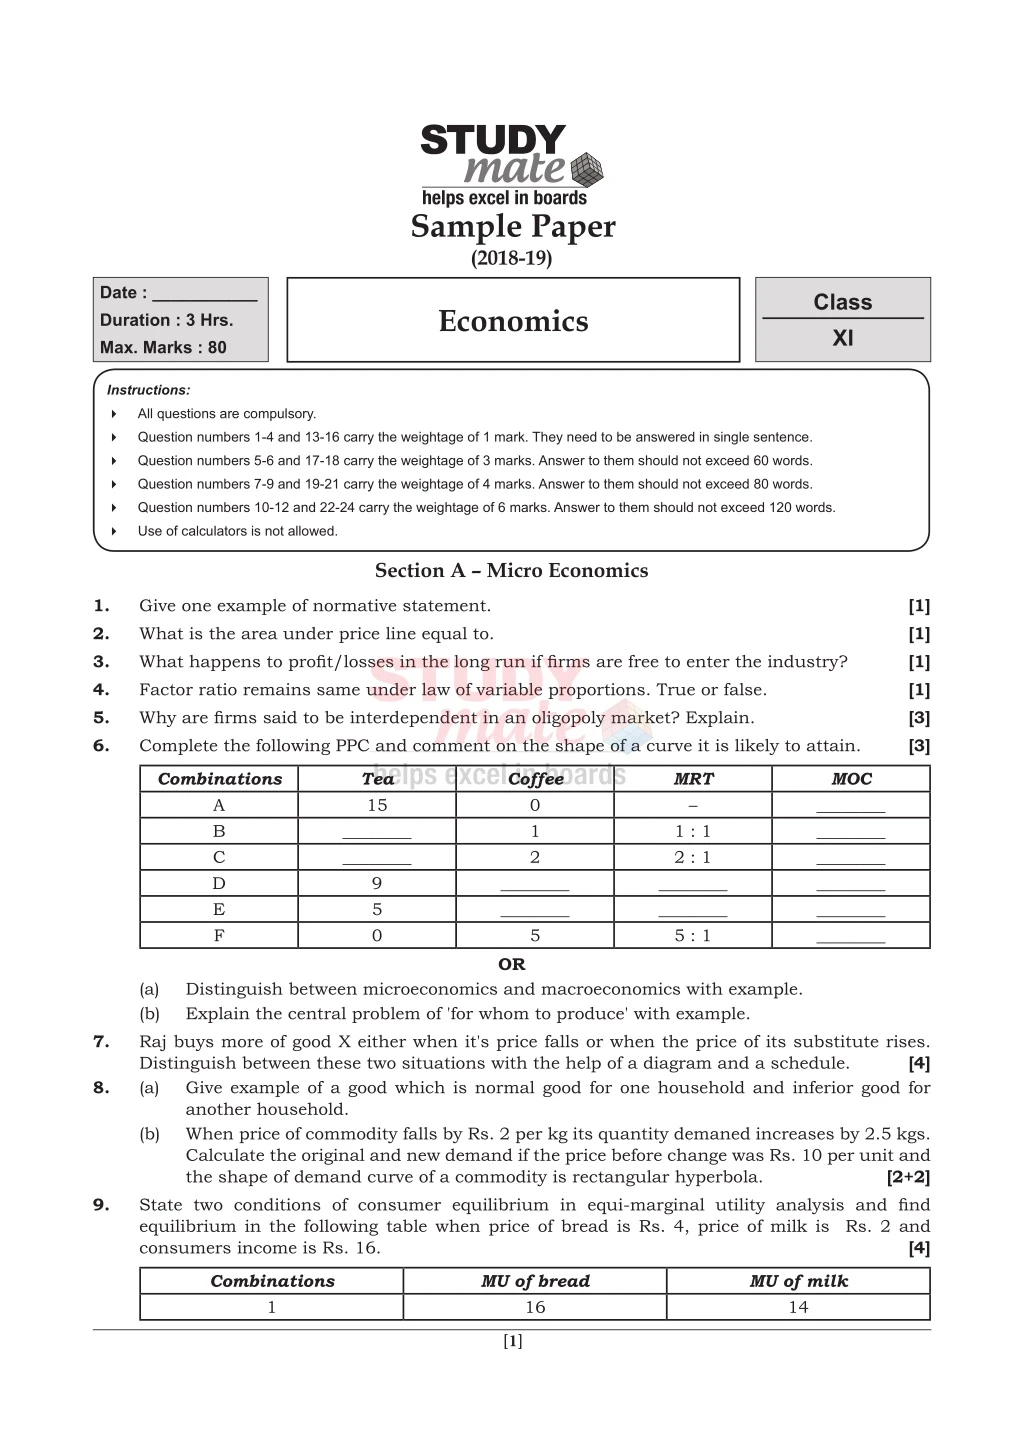
Sample Paper (2018-19) Date : ___________ Duration : 3 Hrs. Max. Marks : 80 Class XI Economics Instructions: 4 All questions are compulsory. 4 Question numbers 1-4 and 13-16 carry the weightage of 1 mark. They need to be answered in single sentence. 4 Question numbers 5-6 and 17-18 carry the weightage of 3 marks. Answer to them should not exceed 60 words. 4 Question numbers 7-9 and 19-21 carry the weightage of 4 marks. Answer to them should not exceed 80 words. 4 Question numbers 10-12 and 22-24 carry the weightage of 6 marks. Answer to them should not exceed 120 words. 4 Use of calculators is not allowed. Section A – Micro Economics 1. 2. 3. 4. 5. 6. Give one example of normative statement. What is the area under price line equal to. What happens to profit/losses in the long run if firms are free to enter the industry? Factor ratio remains same under law of variable proportions. True or false. Why are firms said to be interdependent in an oligopoly market? Explain. Complete the following PPC and comment on the shape of a curve it is likely to attain. [1] [1] [1] [1] [3] [3] Combinations A B C D E F Tea 15 Coffee 0 1 2 ________ ________ 5 MRT – 1 : 1 2 : 1 ________ ________ 5 : 1 MOC ________ ________ ________ ________ ________ ________ ________ ________ 9 5 0 OR 7. (a) (b) Raj buys more of good X either when it's price falls or when the price of its substitute rises. Distinguish between these two situations with the help of a diagram and a schedule. (a) Give example of a good which is normal good for one household and inferior good for another household. (b) When price of commodity falls by Rs. 2 per kg its quantity demaned increases by 2.5 kgs. Calculate the original and new demand if the price before change was Rs. 10 per unit and the shape of demand curve of a commodity is rectangular hyperbola. State two conditions of consumer equilibrium in equi-marginal utility analysis and find equilibrium in the following table when price of bread is Rs. 4, price of milk is Rs. 2 and consumers income is Rs. 16. Distinguish between microeconomics and macroeconomics with example. Explain the central problem of 'for whom to produce' with example. [4] 8. [2+2] 9. [4] Combinations 1 MU of bread 16 MU of milk 14 [1]
2 3 4 5 6 12 8 4 2 0 10 8 6 3 1 OR A consumer is willing to sacrifice 3 unit of X to obtain one more unit of Y. Price of X and Y are Rs. 6 and Rs. 3 respectively. Answer the following questions. (a) Is the consumer in equilibrium. What would be he do to maximise his satisfaction given the price of two commodities. (b) Higher indifference curve means higher utility. Explain. 10. (a) Complete the following table: [6] Output 0 1 2 3 4 AFC – – – – – TFC 50 – – – – TVC – – 18 – 20 MC – 10 – 6 – (b) What is the behaviour of TP and MP when more units of variable factor are employed with fixed factors in the short run. Find out the level of output at which the producer is in equilibrium under perfect competition when price of a commodity is Rs. 20 (using following schedule). 11. (a) [3+3] Output TC Supply curve is the rising portion of MC curve over and above the minimum of AVC? Do you agree. Support your answer with reason. A severe drought result in a drastic fall in the output of rice. Analyse how will it affect the market price of wheat. Explain the implication of ceiling on price by government. Use diagram. 1 2 42 3 4 76 5 6 7 23 60 95 115 137 (b) 12. (a) (b) [6] Section B – Statistics 13. What is the difference between linear and curvilinear correlation. 14. Quartile is a type of: (a) Mathematical average (c) Partition value 15. Coefficient of variation is a percentage expression of (a) Mean deviation (b) Q.D. 16. The index of prices is estimated to be 112 in 2014. In comparison to the base year prices in 2014 are higher by what percentage. 17. Distinguish between primary data and secondary data. OR Explain any three qualities of a good questionnaire. 18. Find the missing item, if mean of the following series is 50. [1] [1] (b) Statistical average (d) None [1] (c) S.D. (d) None [1] [3] [3] Marks No. of student 30 1 35 2 40 3 ? 4 50 6 75 4 [2]
19. Represent the following data of faculty-wise distribution of students of a college for 3 different years by multiple bar diagram. [4] Year Arts Commerce Science 2005 2006 2007 540 650 730 325 410 520 250 275 350 OR Show the following details of the monthly expenditure of two families given below by sub- divided bar diagram or component bar diagram. Item of Expenditure (Expenditure) Food Clothing House Rent Miscellaneous Savings 20. Find out mode of the following series. Family A (income 25,000) Family B (income 40,000) 10,000 5,000 4,000 4,500 1,500 12,000 10,000 6,000 8,000 4,000 [4] Size Frequency 8 5 9 6 10 8 11 7 12 9 13 8 14 9 15 6 21. For the following data calculate Standard Deviation taking assumed mean = 24.5. [4] Class Frequency 10 – 19 4 20 – 29 5 30 – 39 6 40 – 49 2 50 – 59 3 22. Draw a ‘less than’ ogive and ‘more than’ ogive curves for the following frequency distribution : [6] Marks No. of Student 23. From the following data, calculate price index numbers of 2007 with 1993 as base by (i) Laspeyre’s Method (ii) Paasche’s Method, (iii) Fisher’s Method. 0–10 3 10–20 4 20–30 8 30–40 10 40-50 3 50-60 2 [6] Marks Commodity A B C D Base Year (1993) Price (`) p0 20 50 40 20 Current Year (2007) Price (`) p1 40 60 50 20 Quantity q0 8 10 15 20 Quantity q1 6 5 15 25 24. Calculate the coefficient of correlation of the following data by the Spearman’s Rank Correlation method: X 19 24 Y 9 22 OR Calculate the coefficient of correlation for the following data by the Actual Mean Method. X 12 15 18 Y 6 8 10 [6] 12 20 23 14 19 22 16 18 21 12 24 14 27 16 30 18 vvvvv [3]
Hints/Solutions to Sample Paper (2018-19) Date : ___________ Duration : 3 Hrs. Max. Marks : 80 Class XI Economics 1. 2. 3. 4. 5. Minimum wags should be guaranteed by the Government in all economic activities. TR Firms will earn number normal profit in the long run if entry & exist ore free. False, factor ratio changes as more of variable factors are employed with fixed factors. This is because when the number of competitors is few, any change in price, output of product by a firm will have direct effect on the sales of rivals, who will then retaliate by changing their own prices, output or advertising technique as the case may be. It is, therefore, clear that an oligopolistic firm must consider not only the market demand for its product, but also the reactions of other firms in the industry to take any major decision. 6. Combination Tea Coffee MRT MOC A 15 0 - - B 14 1 1 : 1 1 C 12 2 2 : 1 2 D 9 3 3 : 1 3 E 5 4 4 : 1 4 F 0 5 5 : 1 5 OR (a) MICROECONOMICS MACROECONOMICS 1. It is the study of individual economic units, like price of a particular commodity, output of a firm, etc. 1. It is the study of an economy as a whole or national aggregates like inflation, national income etc. 2. Price determination and allocation of resources is the main or central problem. Thus, it is also called as Price-theory 2. Determination of level of income and output is the main of central problem. Thus, it is also called as Theory of Income and Empowerment. 3. It is analysed through demand and supply of a particular or good/factor. 3. It is analysed through aggregate demand and aggregate supply in the economy. 4. It deals with how to attain consumer equilibrium, producer equilibrium, etc. For Whom to Produce? Once the problems of ‘what’ and ‘how’ to produce are solved, the goods are then produced. Because the resources and the resulting output of goods is limited, the third basic economic decision, which must be taken is ‘for whom to produce’. ‘For whom to produce’ means how the national produce is to be distributed among the members of the society. In other words, for whom to produce means who should get how much of the total amount of goods and services produced in the economy. Thus, the third problem is the problem sharing of the national produce. The distribution of national output and income is done in the following two ways: (i) Inter-Personal distribution: This implies distribution among individuals in the society (ii) Factoral distribution: This implies distribution among different factors of production, namely, land, labour, capital and entrepreneur. The main question revolves around that whether distribution promotes equality or not. Promotion of equality in the society would require equitable distribution of output in the economy. This would lead to a greater social welfare but at the same time, may diminish the incentive to produce more. On the other hand, inequality will induce a higher level of production and thus, a higher growth rate for the economy. The choice varies in different economic systems. While, socialist economy would definitely promote social welfare by equal distribution, a capital economy would lead to unequal distribution but a higher growth rate. 4. It deals with the determination of equilibrium level of national income, output, etc. (b) [4]
7. Increase in Demand Vs Expansion of Demand BASIS INCREASE IN DEMAND EXPANSION OF DEMAND Meaning Increase in demand means rise in quantity demanded due to change in factors other than own price of the good. Here, consumer demands more quantity at the same price. Expansion of demand means rise in quantity demanded due to fall in price of the commodity itself. Reasons 1. Favourable change in taste 2. Increase in price of substitute goods. 3. Fall in price of complementary goods 4. Increase in income of consumers (incase of normal goods) 5. Fall in income of consumers (in case of inferior goods.) It is caused by fall in price of the commodity itself Shift vs Movement There is rightward shift in demand curve. This is because there is a change in demand. There is a downward movement along the demand curve. This is because there is change in quantity demanded. Schedule and dig. 8. (a) A good can be a normal good for the consumer at some levels of income and an inferior good at other levels of income. For example, at very low levels of income, as income of a consumer increases, he increases demand for coarse cereals because his level of consumption is below the minimum. But after a certain level of income, any increase in income of the consumer will reduce his consumption of coarse cereals like maize, bajra etc. because he will now substitute superior cereals like wheat and rice. Price before change = P = 10/unit Change in price = DP = 2/kg Increase in Q.d = DQ = 2.5 kg ∈d = 1 [ given rectangular hyperbola] (b) ∆ ∆ Q P P Q × = ε d 2 5 2 . 10 Q × = 1 P = 10 P1 = 8 4P = 2 q = ? <19> 2.5 q1 = ? Q = 12.5 kg Original demand = 12.5 kg New demand = Q + DQ = 12.5 + 2.5 = 15 kg [5]
9. MU of bread in terms of money Mu in terms of money Combination MU of bread MUr 1 2 3 4 5 6 16 12 8 4 2 0 4 3 2 1 14 10 8 6 3 1 7 5 4 3 0.5 0 1.5 0.5 Consumer will be in equilibrium when be consumers 2 unit of breads & 4 units of milk because at this consumption bundle. MU Px Pr 4 2 MU 12 6 = = = = 3 units. r r & Also 4.2 + 2.4 = 16 consumer spent all of his income. OR (a) (b) No consumer is not in equilibrium or MRS ≠ MRε 3 ≠ 2 As consumer is willing to sacrifice more unit of 4 then what market required (i) The consumer will consume more of x. (ii) Marginal utility of x falls due to law of DMU. MRSxy falls. He will consumer more of x tills MRSx4 = MRE. This is because a higher indifference curve represents more quantity of both the goods or at least of one good. Since we assume that a consumer has monotonic preferences i.e., more goods means more utility, a higher IC representing more amount of goods, shows a higher level of utility. (iii) (iv) (c) 10. (a) Output AFC ∞ TFC TVC MC 0 1 2 3 4 50 50 50 50 50 – – 50 25 10 18 24 20 10 8 6 4 16.67 12.5 (b) Refer studymate book 11. (a) Output TC MC Price AR TR = P × Q MR 1 2 3 4 5 6 7 23 42 60 76 95 115 137 23 19 18 16 19 20 22 20 20 20 20 20 20 20 20 40 60 80 100 120 140 20 20 20 20 20 20 20 At output levels 1st and 6th units, both MR and MC are equal, which is 20 in both the cases. But producer is in equilibrium at 6th unit only where profit is maximum (100) (b) Refer studymate [6]
12. (a) P1 E1 Price ( ) ` (Wheat) E P D S Q Q1 QD and Qs of wheat Demand & wheat Rises (Demand shit rightwards Situation of excess demand in the marginal Excess demand leads to rise in price due to competition among buyers Market price rises When price rises expansion in supply and contraction in demand till new equilibrium is establish till ε1. Shortage: Since the price is set below the equilibrium price, there is excess demand in the market. All of the consumers’ needs, cannot be met because producers supply less at a lower price. Thus, there is a shortage in the market. Black marketing: A black market is are in which the goods are sold illegally at a higher price than fixed by the government. Since there is a shortage in the market due to price ceiling, producers try to exploit the consumers. Since the demand cannot be met completely, some consumers are ready to pay a higher price for the good needed. On the other hand, some sellers are also interested in getting a higher price to get more profits. In this way, both buyers and sellers indulge in illegal transaction. As a result, the price sometimes rises even above the equilibrium price and the entire purpose of price ceiling is lost. Rationing: Since there is a shortage in the market the consumers cannot get all what they want. Because of limited supply, the government distributes the essential goods in limited quantities to the consumers at the control price. This is known as rationing and is done through ration shops. For this, government has established Public Distribution System (PDS). It is necessary to accompany price ceiling with rationing so as to protect the consumers and prevent emergence of black market. Linear correlation is said to exist if the amount of change in one variable tends to bear a constant ratio to the amount of change in the other variable. In non linear or curvilinear correlation, the amount of change in one variable does not bear a constant ratio to the amount of charge in the other related variable. (c) (d) 12% Ø Ø Ø Ø Ø (b) 13. 14. 15. 16. 17. Basic Primary Data Secondary Data Time factor It requires longer time for data collection. Secondary data requires less time. Cost Factor The collection of primary data requires a considerable amount of money and personals as whole plan of investigation is initiated. The collection of secondary data is cheaper as it is taken from published or unpublished material. Reliability and suitability Primary data is more reliable and suitable to the enquiry as the investigator himself collects it. Secondary data is less reliable and less suitable as someone else has collected the data which may not serve the purpose. Precautions There is no great need for precautions while using primary data. Secondary data should be used with great care and caution. Organization Factor Collection of primary data requires elaborate organization set up. There is no need for organizational set up in case of secondary data. The basic difference between primary data and secondary data is of ‘degree’. The data collected by one will be primary, but the same data used by another will make it secondary. For example, data collected by Ministry of Human Resource with (a) Number of Questions : The number of questions should be as small as possible. Long questionnaires discourage people from completing them. Only those questions which have a direct relevance to the problem be include. (b) Simple and short Questions: The questions should be clear, brief, and unambiguous. The question should be framed in such a manner that their answer are specific and precise. (c) Avoid Questions requiring calculations: The questions relating to mathematical computations or questions which force the respondent to recollect from his memory should not be asked. For example, informants should not be asked yearly income, since in most of the cases they are paid monthly. [7]
18. Let the missing item be x Calculation of Missing item Marks (X) No. of students (f) fX 30 35 40 x 50 75 1 2 3 4 6 4 30 70 120 4x 300 300 ∑f = 20 ∑f X = 820 + 4x =∑ fX f X ∑ 820 + x 4 = 50 20 19. 50 × 20 = 820 + 4x x = 45 marks Missing Marks = 45 Marks OR 20. The frequencies of two items: 12 and 14 have the highest frequency of 9. So, grouping of frequency is essential. The method of grouping will be used for determination of mode. [8]
Table 1 : Grouping Table Size (X) Frequency (f) In two’s In Three’s Column I Column II Column II Column IV Column V Column VI 8 9 5 6 8 7 9 8 9 6 } 11 } 14 19 10 11 12 13 14 15 21 } 15 } } } 19 } 16 } 17 24 } 26 }17 } } 23 } 15 Table 2 : Analysis Table Column No. 8 9 10 11 12 13 14 15 I II III IV V VI Total – – 1 2 5 4 3 – The size 12 is occuring maximum number of times (5 times). So, Mode = 12. Ans. Mode = 12 21. This is a case of inclusive class-intervals. So, it has to be converted into exclusive series. fd′ d′2 t′d2 Marks X No. of students Mid-point d = m – A − X A ′ = d C f m A = 24.5 C = 10 9.5 – 19.5 4 14.5 –10 –1 –4 1 4 19.5 – 29.5 5 24.5 (A) 0 0 0 0 0 29.5 – 39.5 6 34.5 +10 +1 +6 1 6 39.5 – 49.5 2 44.5 +20 +2 +4 4 8 49.5 – 59.5 3 54.5 +30 +3 +9 9 27 N = Σf = 20 Σfd′ = 15 Σfd′2 = 45 2 ∑ ∑ × 2 ′ ′ fd N fd N σ = − Standard deviation ( ) C (i) Σfd′2 = 45; N = 20; Σfd′ = 15; C = 10 2 45 20 15 20 − × σ = = − × = × = 2 25 . 5625 10 . 1 6875 10 . 12 99 . 10 [9]
22. For ‘Less than’ and ‘More than’ ogive curves, frequency distribution will be converted into cumulative frequency as shown in the following table: Cumulative Frequency Distribution Marks No. of student Marks No. of students Less than 10 Less than 20 Less than 30 Less than 40 Less than 50 Less than 60 3 7 More than 0 More than 10 More than 20 More than 30 More than 40 More than 50 30 27 23 15 5 2 15 25 28 30 By plotting less than cumulative frequency against the upper limit of the class-interval and more than cumulative frequency against the lower limit of the class-interval, we get the following ‘less than’ and ‘more than’ ogive curves (see figure) 23. Construction of Price Index Numbers Base Year (1993) Current Year (2007) Commodity Quantity q0 8 10 15 20 Quantity q1 6 5 15 25 p0q0 p0q1 p1q0 p1q1 Price (`) p0 20 50 40 20 Price (`) p1 40 60 50 20 A B C D 160 500 600 400 Σp0q0 120 250 600 500 Σp0q1 320 600 750 400 Σp1q0 240 300 750 500 Σp1q1 =1,660 =1,470 =2,070 =1,790 (i) Laspeyre’s Method ∑ ∑ p q p q 0 2 070 1 660 , , 1 0 = × = × = P 100 100 124 69 . 01 0 (ii) Paasche’s Method ∑ ∑ p q p q 0 1 790 1 470 , , 1 1 = × = × = P 100 100 121 77 . 01 1 (iii) Fisher’s Method ∑ ∑ ∑ ∑ p q p q 0 p q p q 0 1 0 1 1 = × × P 100 01 0 1 2 070 1 660 , , 1 790 1 470 , , = × × = × = × = 100 1 51835 100 . 1 2322 100 . 123 22 . Ans. (i) Laspeyre’s = 124.69; (ii) Paasche’s = 121.77; (iii) Fisher’s = 123.22. [10]
24. Calculation of Rank Correlation X Y R1 R2 (R1 – R2) D D2 19 24 12 23 19 16 9 22 20 14 22 18 3.5 6 1 5 3.5 2 1 +2.5 +0.5 –3 +3 –2 –1 6.25 0.25 9 9 4 1 5.5 4 2 5.5 3 ΣD2 = 29.50 N = 6 Here, number 19 is repeated twice in series X and number 22 is repeated twice in series Y. Therefore, in X, m = 2 and in Y, m = 2. 1 1 2 2 3 Σ + − + − + D m ( m ) m ( m ) ........... 6 12 12 k= − r 1 3 − N N ∑D2 = 29.50; N = 6 1 1 3 3 + − + − . ( ) 122 ( 2 ) 6 29 50 122 2 = − 1 3 − 6 + 6 + × 210 0 5 . ) . 6 29 50 ( . 0 5 . 6 30 5 = − = − = 1 1 0 128 . 210 Ans. Rank Coefficient of correlation = 0.128. There is very low degree of positive correlation. OR Calculation of Coefficient of Correlation (Actual Mean Method) X-Series Y-Series X x2 Y y2 xy = − = − x X X y Y Y 12 –9 81 6 –6 36 54 15 –6 36 8 –4 16 24 18 –3 9 10 –2 4 6 21 0 0 12 0 0 0 24 +3 9 14 +2 4 6 27 +6 36 16 +4 16 24 30 +9 81 18 +6 36 54 ∑X = 147 X N Y N ∑x = 252 ∑Y = 84 ∑y2 = 112 ∑xy = 168 =∑ 147 7 84 7 = = X 21 =∑ = = Y 12 ∑ XY × ∑ 168 168 28 224 , 168 168 = = = = = = Y 1 × 232 112 2 2 ∑ X Y vvvvv [11]