Download
1 / 26
260 likes | 331 Views
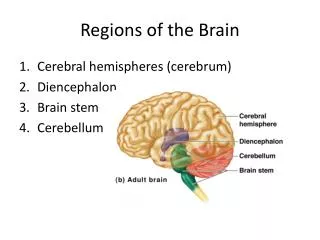
Dynamic Phase Coupling. For studying synchronization among brain regions Relate change of phase in one region to phase in others. Region 2. Region 1. ?. ?. Phase Interaction Function. Region 3. One Oscillator. Two Oscillators. Two Coupled Oscillators. 0.3. Different initial phases.

E N D
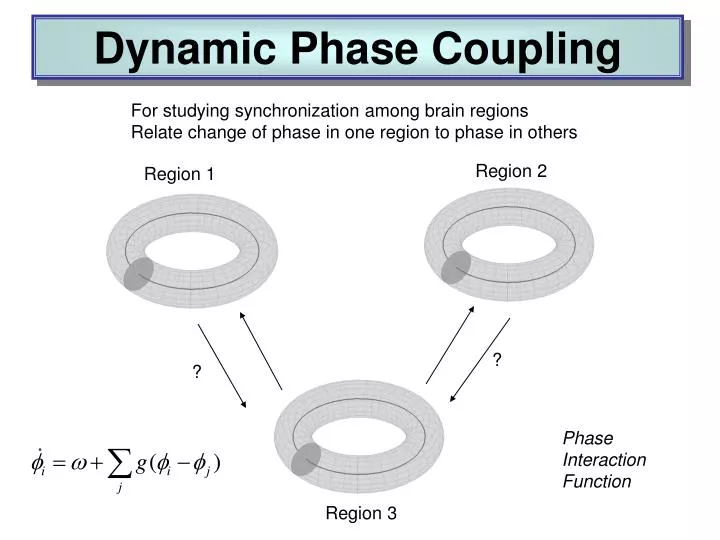
Dynamic Phase Coupling For studying synchronization among brain regions Relate change of phase in one region to phase in others Region 2 Region 1 ? ? Phase Interaction Function Region 3
Bidirectional coupling 0.3 0.3
Hippocampus Septum Connection to Neurobiology: Septo-Hippocampal theta rhythm Denham et al. 2000: Wilson-Cowan style model
Hippocampus Septum Hopf Bifurcation A B A B
For a generic Hopf bifurcation (Ermentrout, Mathemat. Neurosci, 2010) See Brown et al. 04, for PRCs corresponding to other bifurcations
Questions • Duzel et al. find different patterns of theta-coupling in the delay period • dependent on task. • Pick 3 regions based on [previous source reconstruction] • 1. Right MTL [27,-18,-27] mm • 2. Right VIS [10,-100,0] mm • 3. Right IFG [39,28,-12] mm • Fit models to control data (10 trials) and hard data (10 trials). Each trial • comprises first 1sec of delay period. • Find out if structure of network dynamics is Master-Slave (MS) or • (Partial/Total) Mutual Entrainment (ME) • Which connections are modulated by (hard) memory task ?
Data Preprocessing • Source reconstruct activity in areas of interest (with fewer sources than • sensors and known location, then pinv will do; Baillet 01) • Bandpass data into frequency range of interest • Hilbert transform data to obtain instantaneous phase • Use multiple trials per experimental condition
MTL Master VIS Master IFG Master 1 IFG 3 5 VIS IFG VIS IFG VIS Master- Slave MTL MTL MTL IFG 6 VIS 2 IFG VIS 4 IFG VIS Partial Mutual Entrainment MTL MTL MTL 7 IFG VIS Total Mutual Entrainment MTL See also Rosa et al. Post-hoc Model Selection, J. Neurosci. Meth. 2011
When comparing two models, a posterior probability of 0.95 corresponds to a Bayes factor of 20. Or log Bayes factor of 3. LogEv Model See also Random Effects Bayesian Model Inference to look for consistency of model selection in a group of subjects (Stephan, Neuroimage, 2009).
Summary • Statistical Parametric Mapping • Multivariate Analysis • Connectivity Modelling • Role of Oscillations in Memory http://www.fil.ion.ucl.ac.uk/~wpenny
Thank you to • Wellcome Trust • Kai Miller (WashU) • EmrahDuzel (UCL) • Gareth Barnes (UCL) • LluisFuentemilla (UCL) • Vladimir Litvak (UCL) • STAMLIN organisers !
Control fIFG-fVIS fMTL-fVIS
Memory fIFG-fVIS fMTL-fVIS
MEG MRI