Download
1 / 40
400 likes | 520 Views
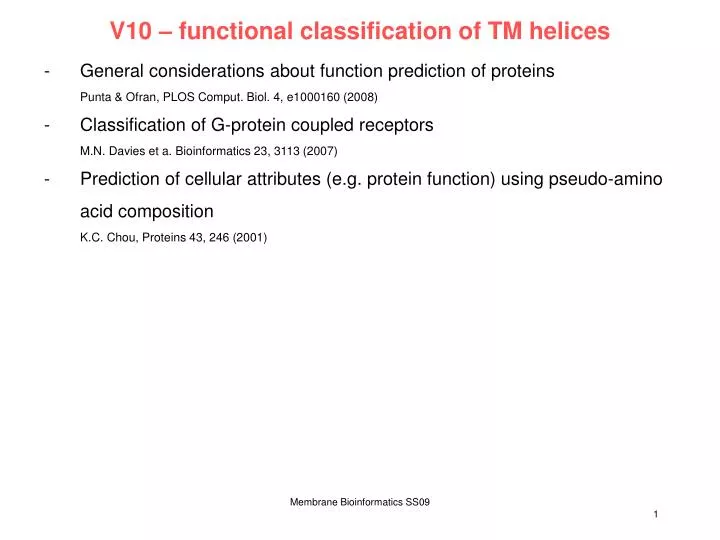
V10 – functional classification of TM helices. General considerations about function prediction of proteins Punta & Ofran, PLOS Comput. Biol. 4, e1000160 (2008) Classification of G-protein coupled receptors M.N. Davies et a. Bioinformatics 23, 3113 (2007)

E N D
V10 – functional classification of TM helices • General considerations about function prediction of proteins • Punta & Ofran, PLOS Comput. Biol. 4, e1000160 (2008) • Classification of G-protein coupled receptors • M.N. Davies et a. Bioinformatics 23, 3113 (2007) • Prediction of cellular attributes (e.g. protein function) using pseudo-amino acid composition • K.C. Chou, Proteins 43, 246 (2001) Membrane Bioinformatics SS09
In Silico Function Prediction: What is protein function? • What is the function of the • protein that is described in • this paper? • (1) X-ray structure of CbiF, an enzyme implicated in the biosynthesis of vitamin B12 (cobalamin). • (2) More specifically, CbiF transfers a methyl group from an S-adenosyl-L-methionine molecule to a precursor of vitamin B12 (cobalt-precorrin-4). • (3) Vitamin B12 is a compound that “helps maintain healthy nerve cells and red blood cells, and is also needed to make DNA”. • (4) Vitamin B12 deficiency is related to anemia, as well as to several neurological and psychiatric symptoms. Punta & Ofran, PLOS Comput Biol 4, e1000160 (2008) Membrane Bioinformatics SS09 2
In Silico Function Prediction: What is protein function? • As we see, CbiF function comes in different flavors: • molecular/enzymatic (methyltransferase), • metabolic (cobalamin biosynthesis—directly—and DNA biosynthesis—indirectly), and • - physiological (maintenance of healthy nerve and red blood cells, through B12), along with possible consequences related to their malfunctioning. • There are, obviously, numerous ways to describe each of these aspects of the protein function. • Enzymatic function, for example, may be characterized through: • - reaction (methylation), • - substrate (cobalt-precorrin-4), or • - ligand (S-adenosyl-L-methionine). Punta & Ofran, PLOS Comput Biol 4, e1000160 (2008) Membrane Bioinformatics SS09 3
Ontologies Several large-scale projects attempted to respond to this challenge by building classification systems or ontologies of biological functions. (1) launched as early as 1955 by the International Congress of Biochemistry: Enzyme Commission should establish a nomenclature for enzymes. Each enzymatic function is described by 4 EC numbers. E.g. carboxylesterase (3.1.1.1) and isochorismatase (3.3.2.1) share the basic enzymatic activity of a hydrolase (all hydrolases have 3 as the first number), but they act on different types of bonds: hydrolases with 3.1.-.- act on an ester bond and those with 3.3.-.- act on an ether bond. This system is infinitely expandable to include any new enzyme, but it does not cover functions that are not enzymatic. Punta & Ofran, PLOS Comput Biol 4, e1000160 (2008) Membrane Bioinformatics SS09 4
Gene Ontology (GO) • The Gene Ontology (GO) project provides a controlled vocabulary to describe the function of any gene product in any organism. • The consortium developed 3 structured controlled vocabularies to cope with the multifaceted nature of the biological function. • For each gene product, GO can provide a number for • its cellular component, • the biological process in which it is involved, and • its specific molecular function. • Various algorithms have been proposed to assign a score for the similarity between numbers within each of these three ontologies. • GO has become THE standard for assessing the performance of function prediction methods. Punta & Ofran, PLOS Comput Biol 4, e1000160 (2008) Membrane Bioinformatics SS09 5
Homology is useful but different from “same function” The most widely used approach for function prediction is homology transfer. Given an unannotated protein, this approach suggests searching for an annotated homolog and using the experimentally verified function of the latter to infer the function of the former. However, this procedure should be implemented with caution. Homology is often confused with similarity of function. In reality, homology between two proteins simply means that they have a common evolutionary origin. Whether or not they have since retained similarity in any of their properties is something that needs to be checked in each individual case. Punta & Ofran, PLOS Comput Biol 4, e1000160 (2008) Membrane Bioinformatics SS09 6
In Silico Function Prediction: Homology An important distinction in this context is between orthologous and parologous sequences: orthologs are genes that originated from a common ancestor through a speciation event, while paralogs are the results of duplication events within the same genome. In general, function tends to be more conserved in orthologs than in paralogs. So, when attempting to predict the function of an unannotated protein based on its homology to an annotated one, one should search for orthologs rather than paralogs. Punta & Ofran, PLOS Comput Biol 4, e1000160 (2008) Membrane Bioinformatics SS09 7
Infer homology by sequence similarity The most common way to infer homology is by detecting sequence similarity, e.g. by PSI-BLAST. When investigating the function of a protein, its sequence is aligned against a database of annotated proteins (e.g. SWISS-PROT) to find its homologs of known function. But homology (orthology and paralogy) does not guarantee conservation of function. ** used for global identity which is defined as the alignment length (including gaps) Punta & Ofran, PLOS Comput Biol 4, e1000160 (2008) Membrane Bioinformatics SS09 8
Moonlighting proteins Small differences in sequence can sometimes cause quite radical changes in functional properties, such as a change of enzymatic action, or even a loss or acquisition of the enzymatic activity itself. An extreme case is represented by the so-called “moonlighting proteins” or proteins that perform multiple and, at times, significantly different functions. E.g., η-crystallin is a protein that plays a structural role in the eye lens of several species, while working as an enzyme in other tissues. Homologs of these proteins may retain only some of the original functions. Punta & Ofran, PLOS Comput Biol 4, e1000160 (2008) Membrane Bioinformatics SS09 9
Moonlighting proteins Examples of mechanisms for switching between two functions (1 and 2). (a) A protein can have different functions in different locations within a cell (e.g. when bound to the cell membrane as opposed to DNA). (b) Proteins can have enzymatic activity in the cell cytoplasm but serve as growth factors when they are secreted. (c) Proteins can have different functions when they are expressed by different cell types (e.g. an endothelial cell as opposed to a neuron). (d) Binding of substrate, product or a cofactor can cause a switch in activity. (e) A multimer can have an activity that differs from that of the monomer. (f) Interaction with different polypeptides to form different multisubunit complexes can result in a switch in function. (g) Some proteins can have different binding sites for different substrates. Jeffrey, TIBS 24, 8 (1999) Membrane Bioinformatics SS09 10
Moonlighting proteins Jeffrey, TIBS 24, 8 (1999) Membrane Bioinformatics SS09 11
challenges of multi-domain proteins The multi-domain nature of many proteins can also be the cause of annotation transfer errors. Because databases store entire sequences (e.g. SWISS-PROT), functional annotation of a protein may refer to any of its domains. If the query protein does not align to that specific domain, annotation transfer is totally unjustified and will very likely result in a mis-annotation. While a number of databases and tools attempt to split proteins into domains based on sequence (Pfam, PRODOM, SMART), the most reliable way to identify protein domains is by using, when possible, structural knowledge (SCOP, CATH). Punta & Ofran, PLOS Comput Biol 4, e1000160 (2008) Membrane Bioinformatics SS09 12
In Silico Function Prediction: Homology Homology between two proteins does not guarantee that they have the same function, not even when sequence similarity is very high. But, the higher the sequence similarity the better the chance that homologous proteins in fact share functional features. Correct transfer of functional annotation from a protein to its homolog depends on the type of annotation we want to transfer. E.g. prediction of subcellular localization typically requires lower sequence identity than prediction for enzymatic function. Punta & Ofran, PLOS Comput Biol 4, e1000160 (2008) Membrane Bioinformatics SS09 13
Sequence signatures predict functional traits In some cases, a relatively small sequence signature may suffice to conserve the function of a protein even if the rest of the protein has changed considerably during the course of evolution. Alternatively, non-homologous proteins could acquire the same functional motif independently (convergent evolution). Thus, two proteins that would not find each other in a sequence search may still have common sequence signatures that could surrender their functional relatedness. Clearly, if two proteins have some level of overall sequence similarity and also share a common motif, the confidence of annotation transfer increases. Dedicated computational tools for the identification of functional motifs: PRINT-S, BLOCKS, PROSITE, InterPro, ... They contain a large library of sequence motifs that were collected either manually by experts, or automatically by pattern-searching algorithms. Punta & Ofran, PLOS Comput Biol 4, e1000160 (2008) Membrane Bioinformatics SS09 14
Predict function from structure Structure is more conserved than sequence. Structural information is very helpful for predicting function. Unfortunately, as with sequence, 2 proteins having the same overall structural architecture, and even conserved functional residues, can have unrelated functions. On the other hand, 2 proteins can perform the same function while having radically different structures. Structural similarity between 2 proteins may reveal their common evolutionary origin even in the absence of significant sequence similarity, possibly suggesting similar function. Punta & Ofran, PLOS Comput Biol 4, e1000160 (2008) Membrane Bioinformatics SS09 15
In Silico Function Prediction: Homology • When evaluating the functional implications of a match, we need to consider • how functionally promiscuous a given structural architecture is (i.e., whether or not it is known to relate to many functions), and • we have to check the conservation of functional residues. Functional residues may not be perfectly conserved in proteins of similar function. In fact, specific residues may be responsible for different ligand or substrate binding affinities or for different reaction rates in enzymes. Punta & Ofran, PLOS Comput Biol 4, e1000160 (2008) Membrane Bioinformatics SS09 16
Classification of GRCR function GPCR ligands include an extremely heterogeneous set of molecules including ions, hormones, neurotransmitters, peptides and proteins. All GPCRs contain 7 highly conserved TM segments. Their sequences also contain three extracellular loops (EL1-3), three intracellular loops (IL1-3) as well as the protein N and C termini. The TM segments form seven -helices in a flattened two-layer structure known as the TM bundle, a structure seen in all GPCRs. The GPCRs show a far greater conservation with regard to the 3D structure than to the primary sequence. Davies et al. Bioinformatics 23, 3113 (2007) Membrane Bioinformatics SS09 17
Classification of GRCR function The diversity of the GPCRs means it is difficult to develop a comprehensive classification system for all of the GPCR subtypes. Common standard today: Classification of GPCRs into 6 classes, see the GPCRDB database (Horn et al., 2003). Davies et al. Bioinformatics 23, 3113 (2007) Membrane Bioinformatics SS09 18
GPCR Classes A-C Class A:Rhodopsin-like, which account for over 80% of all GPCRs is the largest of the human GPCR subtypes. There are at least 286 human non-olfactory Class A receptors. The majority bind peptides, biogenic amines or lipidlike substances. Class B:Secretin-like receptors bind large peptides such as secretin, parathyroid hormone, glucagon, calcitonin, vasoactive intestinal peptide, growth hormone releasing hormone and pituitary adenylyl cyclase activating protein. Class C:Metabotropic glutamate receptors (mGluRs) are a type of glutamate receptor that are activated through an indirect metabotropic process. Like all glutamate receptors, mGluRs bind to glutamate, an amino acid that functions as an excitatory neurotransmitter. In contrast to ionotropic receptors, metabotropic receptors do not form an ion channel pore but are indirectly linked with ion-channels on the plasma membrane. Davies et al. Bioinformatics 23, 3113 (2007) Membrane Bioinformatics SS09 19
GPCR classes D-F There are three further GPCR families that are considerably smaller. Class D is composed of pheromone receptors, which are used by organisms for chemical communication. Class E, the cAMP receptors, forms part of the chemotactic signalling system of slime molds. Class F: Members of the minor class of the Frizzled/Smoothened receptors are necessary for Wnt binding and the mediation of hedgehog signalling, a key regulator of animal development. Davies et al. Bioinformatics 23, 3113 (2007) Membrane Bioinformatics SS09 20
GPCR sub-families The 6 different classes can be further divided into sub-families and sub-subfamilies based upon the function of the GPCR protein and the specific ligand to which it binds. Here, the 6 major GPCR families are termed ‘Classes’, the secondary level of classification is termed ‘Sub-families’ and the third level of classification is termed ‘Sub-subfamilies’. Note that not all human GPCRs can be effectively classified using this system. There are approximately 60 ‘orphan’ GPCR proteins that show the sequence properties of Class A Rhodopsin-like receptor but for which there are no defined ligands or functions. It is possible that many of these orphan receptors have ligand-independent properties, specifically the regulation of ligand-binding GPCRs on the cell surface. Davies et al. Bioinformatics 23, 3113 (2007) Membrane Bioinformatics SS09 21
Classification of GRCR function • The function of a GPCR from its primary sequence, and therefore its position within a given hierarchical system, have been predicted using • motif-based classification tools and • machine-learning methods such as Hidden Markov Models or SVMs. • These approaches have applications not only in discovering and characterizing novel protein sequences but also in better understanding relationships between known GPCRs. Davies et al. Bioinformatics 23, 3113 (2007) Membrane Bioinformatics SS09 22
Publicly available servers: GPCRPred • GPCRPred (Bhasin and Raghava, 2004) is a sequence-based SVM-based classifier that determines • whether a sequence is or is not a GPCR; • if it is a GPCR, to which class it belongs, and then, • if it is a Class A protein, to which sub-family it belongs • The vectors are based upon the dipeptide composition. • Each of the 400 possible pairs of amino acids is associated with a vector compo-nent representing the percentage of the primary sequence consisting of that pair. • The program was reported as having a • 99.5% predictive accuracy at the GPCR versus non-GPCR level, • 97.3% accuracy at the Class level and • 85% accuracy at the sub-family level. Davies et al. Bioinformatics 23, 3113 (2007) Membrane Bioinformatics SS09 23
Publicly available servers: GPCRsclass Another server, GPCRsclass (Bhasin and Raghava, 2005), concentrates on the Class A aminergic receptor sub-family. In the first round of analysis, a SVM is generated to distinguish amines from all other GPCRs. Then multiclass SVMs are set up to classify amines into the acetylcholine, adrenoreceptor, dopamine and serotonin subgroups. The SVM requires patterns of fixed length for training and testing. The sequences are transformed to fixed length format by measuring the amino acid and dipeptide compositions, giving vectors of 20 and 400 dimensions, respectively. Davies et al. Bioinformatics 23, 3113 (2007) Membrane Bioinformatics SS09 24
Publicly available servers: GPCRsclass The dipeptide composition has been proved to be far more reliable than the amino acid composition, scoring 99.7% accuracy at discriminating amine from non-GPCRs and 92% are discriminating between the four sub-subfamilies. A similar method involving amino acid, dipeptide and tripeptide compositions (Guo et al., 2006) claimed a 98% accuracy at the Class level. GPCRsclass gave 94% accuracy at the class level when tested with the same dataset. Davies et al. Bioinformatics 23, 3113 (2007) Membrane Bioinformatics SS09 25
publicly available SVM-based GPCR classifiers • Rather than use the primary sequence to perform the classification, • PRED-GPCR (http://athina.biol.uoa.gr/bioinformatics/PRED-GPCR/) was developed using FFT-transformed input data to an SVM on the basis of the hydrophobicity of the amino acid sequence. • Quantitative descriptions of the proteins relating to hydrophobicity, bulk and electronic properties were derived from the • hydrophobicity model, • composition-polarity-volume (c-p-v) model and the • electron–ion interaction potential (EIIP) model. • 3 different hydrophobicity scales—the Kyte-Doolittle Hydrophobicity (KDH), Mandell Hydrophobicity (MH) and Fauche´re Hydrophobicity (FH)—were used. Davies et al. Bioinformatics 23, 3113 (2007) Membrane Bioinformatics SS09 26
publicly available SVM-based GPCR classifiers The sequences are transformed, first, into numerical representations of the sequence based upon the EIIP values and, second, into the frequency domain using the discrete Fourier transform. The output of these transformations is used as the input for the SVM. In the case of an n-class classification problem where n > 2, as is the case for the GPCR families, each i-th SVM, i = 1, . . . ,n, is trained. When using the FH hydrophobicity scale, the technique achieved a reported accuracy of 93.3% and a Matthew’s correlation coefficient of 0.95. However, the range of accuracies between the sub-families varied between 66.7% and 100% (Papasaikas et al., 2004). Davies et al. Bioinformatics 23, 3113 (2007) Membrane Bioinformatics SS09 27
Classification of GRCR function: GPCRTree Also this alignment-independent classification system uses an alternative form of protein data representation to determine differences between protein sequences, namely the physiochemical properties of amino acids. Proteochemometrics is a technique whereby 5 z-values (z1–z5) are derived from 26 real physiochemical properties through the application of principal component analysis. z1 value: accounts for the amino acid’s lipophilicity, z2 value: accounts for steric properties such as bulk and polarisability z3 value: describes the polarity of the amino acid. The electronic effects of the amino acids are described by the z4 and z5 values. Davies et al. Bioinformatics 23, 3113 (2007) Membrane Bioinformatics SS09 28
Classification of GRCR function: GPCRTree These five values are calculated for each amino acid in the sequence, generating a matrix that provides a purely numerical description of the protein’s character. Several sequences in the GPCR dataset contained non-standard amino acid codes not present in the table of z-values. In such cases, the following substitutions were made. Where the sequence contained a ‘B’ (either an asparagine or aspartic acid) the residue was assigned as an asparagine ‘N’. Where the sequence contained a ‘z’ (i.e. either a glutamine or a glutamic acid), the residue was assigned as a glutamine ‘Q’. Where the sequence contained a ‘U’, indicating selenocysteine, the sequence was changed to cysteine ‘C’. All unknown residues ‘X’ were given as alanines ‘A’. Davies et al. Bioinformatics 23, 3113 (2007) Membrane Bioinformatics SS09 29
Classification of GRCR function The data mining algorithms used cannot cope with variable numbers of predictor attributes = e.g. variable sequence length. It is therefore essential to normalize these values such that each protein has the same number of predictor attributes. Here, the arithmetic mean for each z value is computed over the whole protein. This was found to retain predictive accuracy. For each attribute (z-value) x, the mean value for that attribute is the mean of the values of that attribute in a protein over all amino acids (a) where the total number of amino acids in the protein is represented as N. Davies et al. Bioinformatics 23, 3113 (2007) Membrane Bioinformatics SS09 30
Classification of GRCR function Davies et al. Bioinformatics 23, 3113 (2007) Membrane Bioinformatics SS09 31
Classification of GRCR function Davies et al. Bioinformatics 23, 3113 (2007) Membrane Bioinformatics SS09 32
Classification of GRCR function: conclusions The classification of GPCR sequences is very difficult for conventional bioinformatics classification approaches such as sequence similarity or the identification of specific motifs. However, the structural and functional consistency of GPCR proteins suggests that there is an overall conservation of certain key properties that are necessary to maintain the transmembrane bundle that characterizes the group. The effectiveness of proteochemometrics for this type of analysis has already been demonstrated by previous research. However, this is the first time where an alignment-free approach has been used on a dataset of this size. While it appeared to work well in this instance, we expect that other more complex representations will be necessary as we extend this work to other problems in bioinformatics ... Davies et al. Bioinformatics 23, 3113 (2007) Membrane Bioinformatics SS09 33
Classification based on pseudo amino-acid composition Alternative to proteochemometrics or dipeptide composition: pseudo-amino acid composition The idea is, on one hand, to include the main feature of amino acid composition, but on the other, to include information beyond amino acid composition. The conventional amino acid composition contains 20 components, or discrete numbers, each reflecting the occurrence frequency of one of the 20 native K.C. Chou, Proteins 43, 246 (2001) Membrane Bioinformatics SS09 34
Classification using pseudo-amino acid composition K.C. Chou, Proteins 43, 246 (2001) Membrane Bioinformatics SS09
From the hydrophobicity valuesH1(Ri), the hydrophobilicity valuesH2(Ri), and the side-chain massesM(Ri) of the amino acids Ri and Rj, compute the higher-order correlations K.C. Chou, Proteins 43, 246 (2001) Membrane Bioinformatics SS09 36
classification is based on distances between sequences K.C. Chou, Proteins 43, 246 (2001) Membrane Bioinformatics SS09 37
Classification using pseudo-amino acid composition K.C. Chou, Proteins 43, 246 (2001) Membrane Bioinformatics SS09 38
Results with pseudo-amino acid composition K.C. Chou, Proteins 43, 246 (2001) Membrane Bioinformatics SS09
Conclusions Functional annotation is quite difficult and can mean different things. Functional classification e.g. of GPCRs works quite well either based on content of dipeptides, on proteochemometrics, or based on pseudo amino-acid composition. Membrane Bioinformatics SS09 40