Download
1 / 25
250 likes | 403 Views
10–14 December 2007, AGU FALL MEETING. Vegetation dynamics and soil water balance in a water-limited Mediterranean ecosystem on Sardinia, Italy. Nicola Montaldo 1 , John D. Albertson 2 and Marco Mancini 3.

E N D
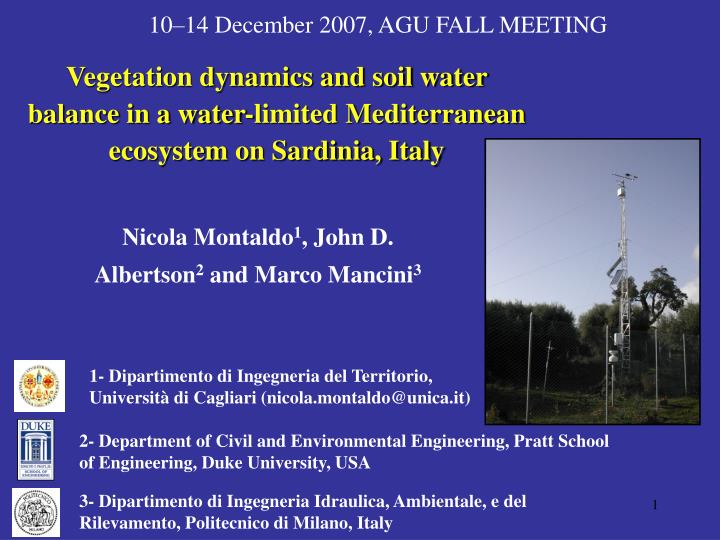
10–14 December 2007, AGU FALL MEETING Vegetation dynamics and soil water balance in a water-limited Mediterranean ecosystem on Sardinia, Italy Nicola Montaldo1, John D. Albertson2and Marco Mancini3 1- Dipartimento di Ingegneria del Territorio, Università di Cagliari(nicola.montaldo@unica.it) 2- Department of Civil and Environmental Engineering, Pratt School of Engineering, Duke University, USA 3- Dipartimento di Ingegneria Idraulica, Ambientale, e del Rilevamento, Politecnico di Milano, Italy
Goals • Field monitoring of land surface fluxes, soil moisture and vegetation dynamics for years with different hydro-meteorological conditions of a water-limited Mediterranean heterogeneous ecosystem; • Development of a 3-component (bare soil, grass and woody vegetation) coupled VDM-LSM for modeling land surface dynamics; • Assess the influence of key environmental factors on the vegetation dynamics for the different annual hydrologic conditions Methodology • Experimental field campaign at Orroli (Sardinia) for monitoring land surface fluxes and vegetation growth… started in May 2003 • Development of a coupled VDM-LSM for competing vegetation species (grass, woody vegetation) • test the coupled model for the Orroli site and data analysis
Flumendosa dam Mulargia dam The experiment: Orroli site (From April 2003)
The experiment: Eddy correlation tower for monitoring land surface fluxes b a d 3 infrared transducers, IRTS-P (Apogee) c a- CNR1 Integral radiometer b- H2O/CO2 gas analyzer c- Soil heat d- CSAT3 Sonic anemometer Energy balance H+LE=Rn-G
The experiment: LAI estimate with the CEPTOMETER LP-80 PAR (photosynthetically active radiation) sensor (LI-190SB) Soil moisture probes (CS616 Campbell sci.) Silt loam
The experiment: Remote sensing observations The tower 1 km Quickbird image Summer: 3 August 2003 (spatial resolution 2.8 m) Quickbird image Spring: 4 May 2004 (spatial resolution 2.8 m) Orroli The tower
The field heterogeneity (Detto et al., WRR 2006) NDVI/NDVIMAX Normalized difference vegetation index (NDVI) of woody vegetation The interpretation of eddy-covariance measurements through the foot print model (a revised 2-D version 2-D version of the foot print model of Hsieh et al. [2000] ) Estimate the source area of the flux at each time step fv,wv(fraction of woody vegetation)
The Land Surface model (LSM).. 3-components Woody vegetation transpiration Patch mosaic Patchs Bare soil Grass Woody veg. Bare soil evaporation Grass transpiration Runoff Infiltration,I Soil moisture, q Decomposition of the Landscape Drainage, Qdr (fv,g+fv,wv+ fbs=1) competition for root zone soil water content • Root zone budget: fv,wv fv,g fbs (Albertson and Kiely, J. Hydrology, 2001; Montaldo and Albertson, J. Hydrometeorology,2(6), 2001)
Woody veg. Bare soil [a(q)] f1(q) f2(T) 1 1 Woody veg. Grass 0 0 qwilt qlim Tmin Topt Detto et al. WRR, 2007 Tmax From observations, using the foot print model • Evapotranspiration ET= Ev,g + Ev,w+ Ebs Ebs=fbsa(q) Ep Penmann-Monteith Canopy resistance with k= w (woody vegetation) or g (grass)
Vegetation dynamic model of the generic vegetation type • Pg : Gross photosynthesis • Green (leaves) biomass • ag , as, ar allocation coefficients, dinamically estimated • Stem biomass Maintenance and growth respirations • Root biomass Senescence Litter fall • Dead biomass Derived from Montaldo et al., [WRR, 2005]; Nouvellon et al., 2001 Production Destruction
PAR (0.38-0.71 mm) Substomatal cavity Gross photosynthesis Montaldo et al., [WRR, 2005] fraction of PAR absorbed by the canopy eP is the leaf photochemical efficiency [g dry mass/ PAR]
Allocation coefficients Derived from Arora and Boer [GCB, 11, 39-59, 2005] Woody vegetation Grass
Comparison of observed and hystorical mean monthly Precipitation and temperature
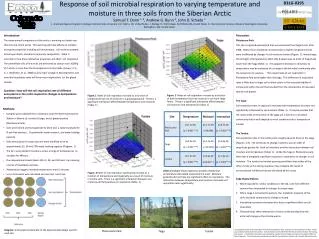
Influence of soil moisture and temperature on grass dynamics during the observed years
Correlation between grass LAI and precipitation (April and May) mean 15-day values of grass LAI versus the aggregated 15-day precipitation values time lagged by 15 days
Conclusions • The yearly variability of hydro-meteorological conditions offered a wide range of conditions for testing the developed 3-component (bare soil, grass and woody vegetation) coupled VDM-LSM model. The model performed well for the whole period of observation and was able to accurately predict vegetation dynamics, soil water balance and land surface fluxes. • Interannual variability of hydromet-conditions can significantly affect vegetation growth in these water limited ecosystems: importance to include VDMs in LSM • The correlation was found to be high when the values of precipitation and LAI are aggregated at 15-day time intervals, and there is a sufficient time lag (15-days) between the forcing (precipitation) and the answer (LAI) Nicola Montaldo (nicola.montaldo@unica.it)
LSM+VDM coupled model Land Surface Model Grass VDM Rainfall Senescence Respiration LAI grass Biomass budget Balance of intercepted water by vegetation Translocation Throughfall Photosynthesis Competition for water Soil water balance Evapotranspiration Woody veg. VDM Photosynthesis Energy balance Drainage Respiration LAI woody veg. Biomass budget Soil heat dynamic Translocation Senescence Atmospheric forcings (Ri, RH, u, T, PAR)
Allocation coefficient model of Arora and Boer (GCB, 11, 39-59, 2005) Woody vegetation Grass