Download
1 / 19
190 likes | 196 Views
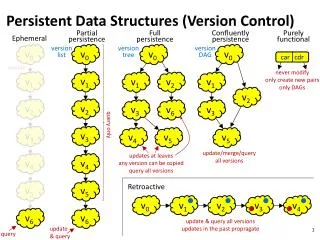
HSeg is a powerful tool for hierarchical image segmentation that allows for segmentation at different levels of detail and maintains region boundaries at full spatial resolution. It can be used for computer-assisted photointerpretation, pre-processing, and automated classification of high-resolution imagery data.

E N D
National Aeronautics and Space Administration HSeg Update James C. Tilton Code 606.3 Computational & Information Sciences and Technology Office NASA Goddard Space Flight Center July 16, 2015 update www.nasa.gov
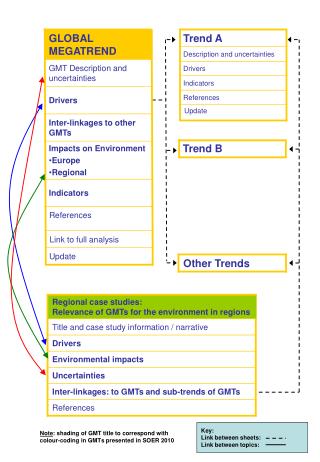
HSeg Background HSegproduces a hierarchical set of image segmentations with the following characteristics: A set of segmentations that • consist of segmentations at different levels of detail, in which • the coarser segmentations can be produced from merges of regions from the finer segmentations, and • the region boundaries are maintained at the full image spatial resolution The HSeg algorithm is fully described in: James C. Tilton, YuliyaTarabalka, Paul M. Montesano and Emanuel Gofman, “Best Merge Region Growing Segmentation with Integrated Non-Adjacent Region Object Aggregation,” IEEE Transactions on Geoscience and Remote Sensing, Vol. 50, No. 11, Nov. 2012, pp. 4454-4467. USGS Global Croplands Working Group Meeting 2
Improved Incorporation of Spatial Information Into HSeg HSeg Background (cont’d): • HSegmodifies HSWO by also aggregating spectrally similar but spatially separated region objects into groups of region objects – called region classes. The HSeg Flowchart: • Swght, ranging from 0 to 1, controls the relative importance of merges between adjacent regions versus non-adjacent regions. USGS Global Croplands Working Group Meeting
Improved Incorporation of Spatial Information Into HSeg HSeg Background (cont’d): • The RHSegapproximation of HSeg has an efficient parallel implementation useful for processing large images: • Lris determined as the number of times the input image must be subdivided to achieve a small enough image size for efficient processing with HSeg. • The rhseg(L,X) function: • Nminis equal to ¼ the number of pixels in the subimage processed at the deepest level of recursion. USGS Global Croplands Working Group Meeting
Incorporating Edge Information into HSWO/HSeg/RHSeg Edge information is incorporated at three different stages: • An initialization stage in which the edge information directs a fast first-merge region growing process (Muerle-Allen)to quickly merge connected areas with edge values <= Et (set by user), and • The normal HSWO/HSeg best merge region growing stage in which the edge information influences the best merge decisions. • In performing processing window artifact elimination in RHSeg. J. L. Muerle, D. C. Allen, “Experimental Evaluation of Techniques for Automatic Segmentation of Objects in a Complex Scene,” in G. C. Cheng, et al. (Eds.), Pictorial Pattern Recognition, Thompson, Washington, DC, pp. 3-13, 1968. USGS Global Croplands Working Group Meeting 5
Frei-Chen Edge Difference Operator The Frei-Chen Edge Difference Operator consists of nine convolution masks: The edge value (EV) is computed from the nine convolution masks as follows: EV = , where and USGS Global Croplands Working Group Meeting 6
Frei-Chen Edge Difference Operator Result: A true color rendition of a 768x768 pixel section of Ikonos data from the Patterson Park/Inner Harbor area of Baltimore, MD. Frei-Chen Edge Difference Operator Result, maximum over spectral bands, thresholded at 0.07. USGS Global Croplands Working Group Meeting 7
Utilizing HSeg in the GFSAD30 Project At least three possibilities: • Use RHSeg/HSeg together with HSegLearn to perform computer assisted photointerpretation of high resolution imagery data (< 5m) to develop ground reference data. • Develop pre-processing techniques to “enhance” the imagery data prior to processing with HSeg. • Develop post-processing analysis approaches for automated classification. USGS Global Croplands Working Group Meeting 8
RHSeg/HSeg together with HSegLearn • HSegLearn takes as input a hierarchical set of image segmentations such as produced by the HSeg best-merge region growing segmentation program. • Through HSegLearn, an analyst specifies a selected set of positive and negative examples of impervious land cover. • HSegLearn searches the hierarchical set of segmentations for the coarsest level of segmentation at which the selected positive examples do not conflict with negative example locations and labels the image accordingly. USGS Global Croplands Working Group Meeting 9
RHSeg/HSeg together with HSegLearn • HSegLearn was developed for and used extensively in a NASA LCLUC program funded project to map urbanization in 2000 and 2010 at the 30m Landsat TM scale to generate 30m scale ground reference data from 1-2m scale satellite imagery data (Quickbird and WorldView). • HSegLearn has been modified to “ignore” region objects of size less than an analyst specified number of pixels. This may make it easier to use HSegLearn in our cropland mapping application. USGS Global Croplands Working Group Meeting 10
HSegLearn Example The HSegLearn Current Region LabelsPanel after the analyst submitted thepositive and negative example regionobjects for processing. The positiveexample regions are colored green andnegative example regions are colored red. Note the generalization of thepositive example regions. The HSegLearn RGB Image Paneldisplaying a subsection of a WorldView2 image in the vicinityof the Charlotte, NC InternationalAirport. The HSegLearn Current Region LabelsPanel after the analyst selected somepositive example region objects(yellow) and some negative exampleobjects (white). USGS Global Croplands Working Group Meeting 11
Pre-processing: Develop pre-processing techniques to “enhance” the imagery data prior to processing with HSeg. For example 15x15 median filter: USGS Global Croplands Working Group Meeting 12
Pre-processing: HSeg result at about 840 region classes for the original (left) and 15x15 median filtered image (right): USGS Global Croplands Working Group Meeting 13
Pre-processing – other computed features: Spectral Analysis Features – for example, NDVI features: For 8-band WorldView 2 images there are NDVIs defined for five band combinations: USGS Global Croplands Working Group Meeting 14
Utilizing HSeg in the GFSAD30 Project Kamini Yadav is experimenting with using a Random Forest classification package available for the R programming language. To facilitate interfacing HSeg with this package, I am considering writing a program in R to read the HSeg output files. This will allow more convenient post-processing of HSeg image segmentation results to provide the needed features for the Random Forest classification. USGS Global Croplands Working Group Meeting 15
Obtaining Very High Resolution NGA The Web-Based Access and Retrieval Portal (WARP) will be definitely retired as of July 31, 2015. Just last week I obtained access to the new Net-Centric Geospatial-Intelligence Discovery Services facility with my PIV credentials. I also recently gained access to the DigitialGlobeEnhancedView Web Hosting Service. USGS Global Croplands Working Group Meeting 16
SignOffPage USGS Global Croplands Working Group Meeting 19