Download
1 / 16
160 likes | 161 Views
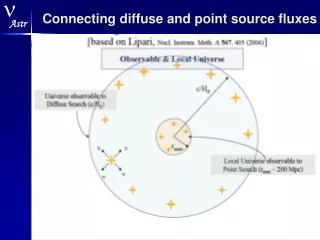
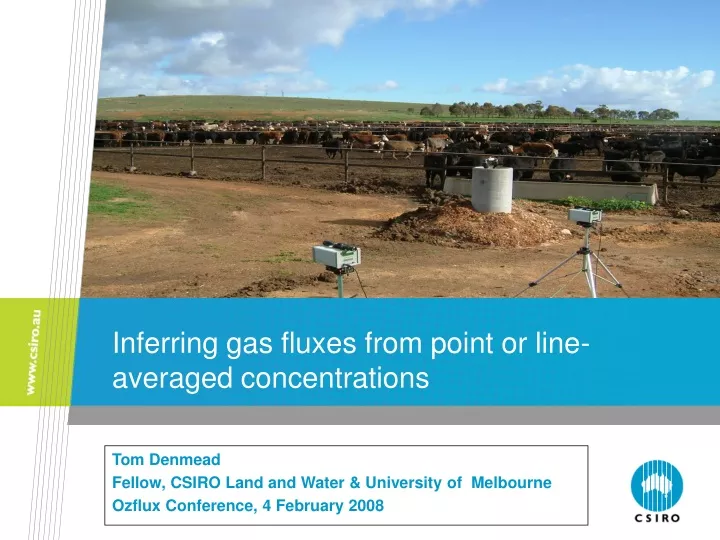
Learn how to calculate gas fluxes from point or line-averaged concentrations using the backward Lagrangian stochastic (bLs) dispersion model.

E N D
Inferring gas fluxes from point or line-averaged concentrations Tom Denmead Fellow, CSIRO Land and Water & University of Melbourne Ozflux Conference, 4 February 2008
A backward Lagrangian stochastic (bLs) dispersion model • The model traces particles backwards from sensor to origin using a Lagrangian dispersion model • Surface fluxes calculated from number of touchdowns inside and outside source area in many simulations: (C/Q)sim = (1/N) Σ |2/w0| C is downwind concentration Q is the surface flux N is the number of trajectories commonly, 50,000 w0 is the vertical velocity of particles at touchdown Q = (C-Cbackground) / (C/Q)sim Point concentration sensor Source area Micromet. wind Touchdowns CSIRO. Inferring gas fluxes from point or line-averaged concentrations
A backward Lagrangian stochastic (bLs) dispersion model • Suitable for point, line or area sources (any shape) • Inputs: geometry of source area height and location of sensor, wind speed and direction, atmospheric stability, gas concentrations upwind and downwind • Uses a software package called WindTrax to calculate surface fluxes from concentration and micrometeorological data Point concentration sensor Source area Micromet. wind Touchdowns CSIRO. Inferring gas fluxes from point or line-averaged concentrations
Point concentration measurements: an example from grazing (315 dairy cows) Ammonia concentrations measured with passive samplers CSIRO. Inferring gas fluxes from point or line-averaged concentrations
WindTrax map 2 adjoining pasture bays grazed in 6 sessions, one-third of a bay at a time Sensors located at heights of 1.4 and 2m on 12 masts on the corners of each grazed section Chemical sensors Meteorological Sensors: 2 anemometers Wind vane Atmos. stability Background concentration unknown Grazed sections CSIRO. Inferring gas fluxes from point or line-averaged concentrations
Sensor numbers: measuring NH3 emissions after N fertiliser applied to the whole bay Average fluxes (μgNH3-N m-2 s-1), 0900-1800, using different sensor combinations; wind direction 170o If background unknown, need 2 sensors If >2 sensors, problem is over-determined & model returns least-squares, best-fit background and flux 2.66 2.33 2 sensors, one upwind & one downwind, each at 1.4m 1.55 2.05 24 sensors, 2 to each mast, at 1.4 and 2m CSIRO. Inferring gas fluxes from point or line-averaged concentrations
Multiple source areas (using 16 sensors) Average fluxes, 0800-1730, μgNH3-N m-2 s-1 Grazed yesterday→ 0.14 Grazed today→ 0.30 -0.02 Ungrazed→ CSIRO. Inferring gas fluxes from point or line-averaged concentrations
An example result: emissions from one grazed section • Before grazing: small NH3 uptake • Continuous NH3 emission during & after grazing • Large NH3 emissions after fertilizing • Emissions cease after irrigation CSIRO. Inferring gas fluxes from point or line-averaged concentrations
Line-average concentration Reflector Laser FTIR Line-averaged concentrations: laser and Fourier Transform Infrared (FTIR) systems • Lasers measure line-averaged gas concentrations up to 1km, FTIR less • Lasers: tripod-mounted, stand alone, battery-operated units; FTIR requires mains power • Suitable for point, line and small area sources Open-path FTIR (CO2,CH4, N2O, NH3) Open-path laser (CO2, CH4, NH3) CSIRO. Inferring gas fluxes from point or line-averaged concentrations
Tests: releases and recoveries Daisy – our virtual cow • CH4, N2O, NH3 released from cylinders through mass-flow controllers • Tests conducted of recoveries from point source and plane source emissions 40m x 15m grid of permeable pipes 40m x 15m grid of permeable pipe CSIRO. Inferring gas fluxes from point or line-averaged concentrations
Tests: releases and recoveries_ point sources • Average NH3 concentrations measured by a laser instrument at 1.5m height along a line of 123m, 10m downwind of a point source of ammonia 0.5m above ground. CSIRO. Inferring gas fluxes from point or line-averaged concentrations
Tests: releases and recoveries_ areal sources • Top: • Recovery by laser of NH3 released from ground level grid, 25m x 25m • Laser 2m downwind of grid • Path 128m • NH3 released at 5L min • Bottom: • Recovery by 2 lasers and FTIR of CH4 released from ground level grid, 40m x 15m • Path 140m CSIRO. Inferring gas fluxes from point or line-averaged concentrations
Example application of open-path systems: CH4 emission from a feedlot with 14,000 cattle WindTrax map of feedlot layout Laser paths Micromet. tower CSIRO. Inferring gas fluxes from point or line-averaged concentrations
Strengths and weaknesses • bLs technique + WindTrax represent a powerful new tool for measuring gas emissions from well-defined source areas • Main advantage: fluxes determined from just one concentration measurement and knowledge of the background concentration + turbulence statistics • Both closed and open-path measuring systems possible • Path lengths of up to 1 km possible, but 100 to 300m seem more reliable • Open –path systems: • Lasers tuned to individual gases: CO2, CH4, NH3 and H2O • FTIR units measure many of the gases of interest in the context of landscape-atmosphere exchanges simultaneously: CO2, CH4, NH3, H2O, N2O and CO • The main disadvantage of the bLs technique may be in its parameterisation of turbulent transport, but many tests have shown that with appropriate precautions, gas emissions can be measured with acceptable accuracy (Flesch et al., 2004; McBain and Desjardins, 2005; Laubach et al., 2008). CSIRO. Inferring gas fluxes from point or line-averaged concentrations
Acknowledgements • Collaborators University of Melbourne: Deli Chen, Debra Turner, Yong Li, Zoe Loh, Julian Hill University of Wollongong: David Griffith, Mei Bai, Glenn Bryant, Travis Naylor DPI Victoria: Kevin Kelly, Frances Phillips Charlton Feedlot Sandalwood Feedlot • Funding Australian Greenhouse Office Meat and Livestock Australia CSIRO. Inferring gas fluxes from point or line-averaged concentrations
Contact Us Phone: 1300 363 400 or +61 3 9545 2176 Email: enquiries@csiro.au Web: www.csiro.au Thank you CSIRO Land and Water and University of Melbourne Tom Denmead Fellow Phone: +61 2 6246 5568 Email: tom.denmead@csiro.au Web: www.csiro.au