Download
1 / 28
290 likes | 525 Views
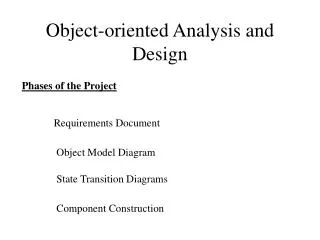
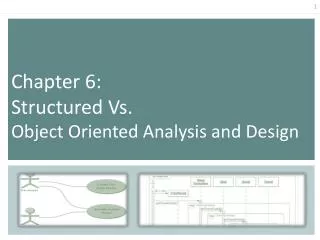
Structured Vs. Object Oriented Analysis and Design SAD Vs. OOAD. Software process model. Modeling. A model is an abstract view of a system We create a model to gain better understanding of an entity, for example a model of a plane is a small plane.

E N D
Structured Vs. Object Oriented Analysis and DesignSAD Vs. OOAD
Modeling • A model is an abstract view of a system • We create a model to gain better understanding of an entity, for example a model of a plane is a small plane. • When the entity is software, the model takes a different form.
A software Model A software model must be capable of representing : • the information that the software transforms, • the functions that enable the transformation to occur, and • the behavior of the system as the transformation takes place.
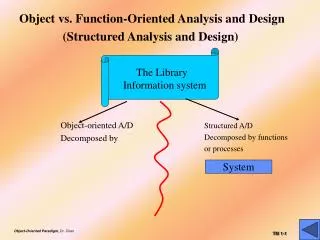
Structured Analysis Vs. Object Oriented Modeling 1-Behavioural Models: Data processing models that show how data is processed as it moves through the system (Data Flow Diagram -DFD and Entity Relation diagram- ER). Will be covered in this course 2- OR Object Models: Use case diagrams and Class diagram. Focus on Objects rather than data or process Covered in previous course
Commonly used UML diagram types • Activity diagrams, which show the activities involved in a process or in data processing . • Use case diagrams, which show the interactions between a system and its environment. • Sequence diagrams, which show interactions between actors and the system and between system components. • Class diagrams, which show the object classes in the system and the associations between these classes. • State diagrams, which show how the system reacts to internal and external events.
1- Context Model for ATM Context models show what lies outside the system boundaries.
2- Interaction models A- Use case • A use case in the MHC-PMS
2- Interaction modelsB- Sequence diagrams • Sequence diagrams are part of the UML and are used to model the interactions between the actors and the objects within a system. • A sequence diagram shows the sequence of interactions that take place during a particular use case or use case instance. • The objects and actors involved are listed along the top of the diagram, with a dotted line drawn vertically from these. • Interactions between objects are indicated by annotated arrows.
3- Structural modelsA- Class diagrams • An association is a link between classes that indicates that there is some relationship between these classes. • When you are developing models during the early stages of the software engineering process, think of objects represent something in the real world, such as a patient, a prescription, doctor, etc.
4- Behavioral models • Behavioral models are models of the dynamic behavior of a system as it is executing. They show what happens or what is supposed to happen when a system responds to a stimulus from its environment.
4- Behavioral modelsA- Data-driven modeling – Activity diagram • Many business systems are data-processing systems that are primarily driven by data. They are controlled by the data input to the system, with relatively little external event processing. • Data-driven models show the sequence of actions involved in processing input data and generating an associated output. • They are particularly useful during the analysis of requirements as they can be used to show end-to-end processing in a system.
Data-driven modeling • Data flow diagrams (DFDs) may be used to model the system’s data processing. • These show the processing steps as data flows through a system. • UML does not support DFDs . UML use activity diagram instead.
4- Behavioral models B- Event-driven modeling - State diagram • Event-driven modeling shows how a system responds to external and internal events.
Ex: DFD Context diagram shows the system boundaries, external entities that interact with the system, and major information flows between entities and the system.
What is CASE? • CASE (Computer Aided Software Engineering) • Programs used to support software process activities such as system modeling, debugging, and testing • Some CASE tools include automatic code generation from diagrams.
References • http://www.slideshare.net/mksaad/structure-vs-object-oriented-analysis-and-design • Sommerville, Ian ,“Software Engineering”, 9th edition, PEARSON