Download

1 / 16
160 likes | 368 Views
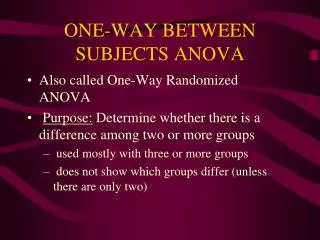
ONE WAY ANOVA. Catrisse Dizon August 2, 2008. Is the most commonly used statistical method for testing hypotheses about 3 or more means. Is the most commonly used statistical method for testing hypotheses about 3 or more means. F – Test

E N D
ONE WAY ANOVA Catrisse Dizon August 2, 2008
Is the most commonly used statistical method for testing hypotheses about 3 or more means
Is the most commonly used statistical method for testing hypotheses about 3 or more means
F – Test The statistical test used in ANOVA for comparing two variances Compared to other tests, “F” test involves a much longer process just to arrive at a single computed figure, the F statistics (Fc).
The purpose of the Analysis of Variance is to establish variations (or sources of differences) between samples and within samples.
Three possible sources of variations: • Variation between samples • Variation within samples • Total variation among the values of all the samples
The end result of the computation is the F - Ratio MSSc Fc = MSSw
The manager of a training outfit for sales representatives would like to know if there might be a significant difference among three methods of instruction (Method A, B and C) that are employed for trainees. A different method is used for each of three separate group of trainees. The same topic is discussed for all groups and the same set of examination questions are given at the end of the training seminar. A sample of the examination scores of six trainees from each of the group is taken.
MSSc Fc = MSSw 160.89 = 15.69 = 10.25
Test of Hypothesis: 1. Ho: There is no significant difference in the scores of the three groups of trainees. this translates to: THERE IS NO SIGNIFICANT DIFFERENCE IN THE THREE METHODS INSTRUCTIONS EMPLOYED. Ha: There is a significant difference in the scores of the three groups of trainees 2. The computed value for the F statistic is: Fc = 10.25 3. The tabular value is: Ft = 6.36
CONCLUSION: • Since the computed value of F (10.25) is greater than the tabular value (6.36), we reject the null hypothesis • Therefore, There is a significant difference in the grades of the 3 groups of trainees • This means further that: There is a difference in the three methods of instruction employed.
Since there is a significant difference in the methods, one has to determine which method is the best and to employ that method. Through several applications, one is able to determine which method will yield consistently high grades for trainees. Suppose the conclusion is that there is no significant difference in the grades? Then the three methods may be considered equally effective and any one of the methods may be used for training purposes.