Download
1 / 19
190 likes | 259 Views
STAPPA/ALAPCO. Fine Particulate Air Monitoring. Improvements in Data Collection and Reporting Spring Membership Meeting 2002. PM 2.5 Data Completeness Report Card. Improvements in collection and reporting SAMWG and EPA Working Together State and Local Agency efforts

E N D
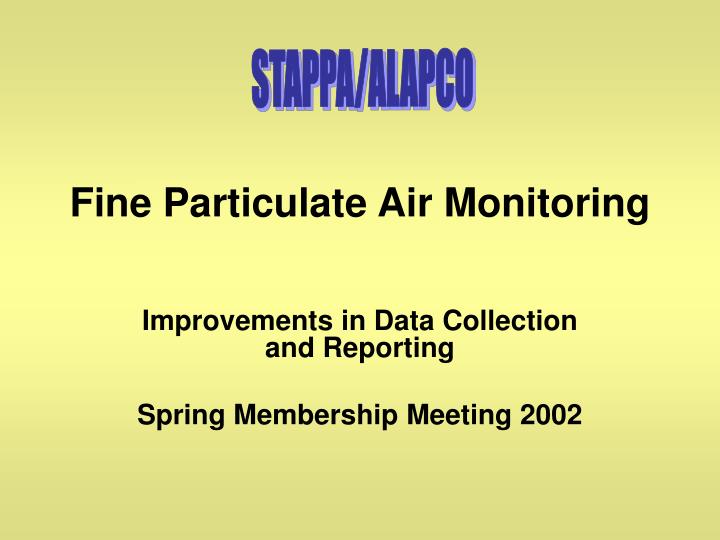
STAPPA/ALAPCO Fine Particulate Air Monitoring Improvements in Data Collection and Reporting Spring Membership Meeting 2002
PM 2.5 Data CompletenessReport Card • Improvements in collection and reporting • SAMWG and EPA Working Together • State and Local Agency efforts • Noteworthy results in 2001 • 1103 station operated all 4 quarters • No systematic equipment issues • AQS issues being resolved • Continued focus is warranted for all pollutants.
Region 1 77% Region 2 69% Region 3 88% Region 4 86% Region 5 88% Region 6 80% Region 7 92% Region 8 87% Region 9 79% Region 10 89% Current 2001 reporting by EPA Region
Look for an MSA update on AIRWEB in May. Many of the 80 sites are redundant within an MSA’s with complete data showing >15.0 annual average.
Continuous PM2.5 Monitoring Sites As of AIRS, 10/02/01 Black = Data reported in AIRS (132) Red = Site registered in AIRS but no data (20) 215 were funded in FY2000 (-83)
National PM2.5 Maps • Yearly depictions • Relative to the Annual NAAQS • Summary 1999-2001
A closer view of eastern US for 99-01 average Data from AQS on April 5, 2002
Keys to Success • Refine networks for efficient operation • Improvement as AQS matures • Reinforce expectations for timely reporting • Focus on new equipment issues