Download
1 / 26

E N D
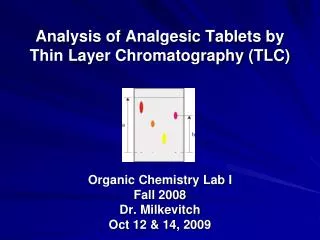
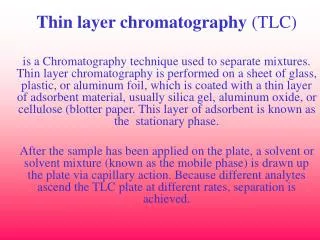
TLC Thin layer chromatography (TLC) is a simple, inexpensive method which requires a minimum of instrumentation and can be used for separation of simple mixtures. It is possible to separate up to 70 samples and standards on a single plate, which makes analysis quick and inexpensive.
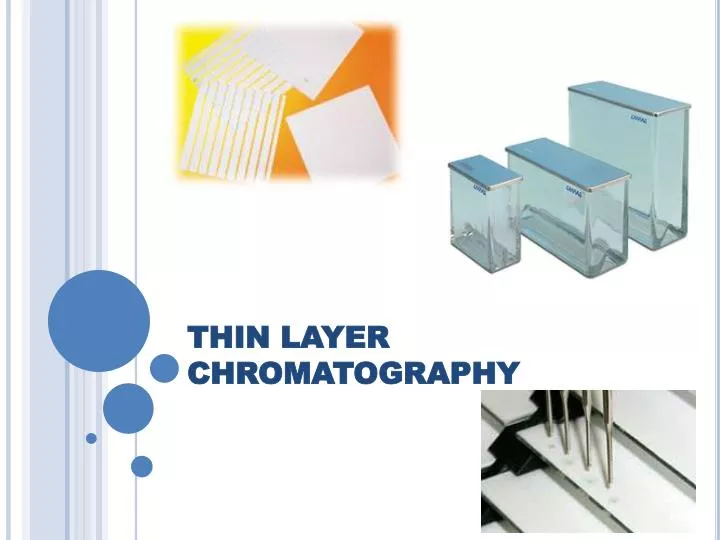
TLC is performed using thin sheets of glass, aluminum or plastic coated with a layer of stationary phase, usually silica gel. However, other coatings such as alumina, Florisil, polyamide, cellulose, C-18, C-8, ion exchangers, and chemically bonded amino, cyano, diol, or phenol layers can also be used.
In TLC, the sample must be carefully applied to the plate to minimize spreading. Sample sizes from 0.1 mg to 50 mg are the best for TLC. Smaller amounts are difficult to visualize, while larger spots result in overloading and variable results. Samples should be dissolved in relatively volatile solvents (0.5 to 5mL) so that the spots do not spread excessively(3-4 mm diameter).
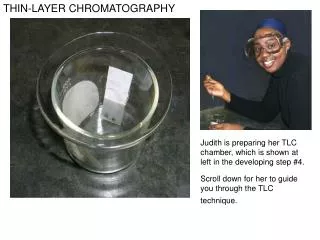
The spotted plate is placed in a development tank with its lower side immersed in solvent to a level below the applied sample spots. The solvent rises due to capillary flow in a process called development. Development times can range from 3-60 minutes.
Retardation factors Rf are calculated by dividing the distance moved by an analyte by the distance moved by the solvent.
Visualizing Spots on the Plate 1) Visible - the bands or spots can be seen immediately. 2) Fluorescence - observed under UV light. 3) Absorb UV - plate has an indicator that when irradiated will show analytes as dark spots on a bright background. 4) Reaction with a chromogenic reagent - These reagents may be general (reacting with many different compounds) or selected (reacting only with certain functional groups. 5) Organic Materials - treat plates with concentrated sulfuric acid and then heat at 200oC. Analytes show up as dark spots. Viewing Chamber using UV light
Two-Dimensional Development More complete separation of sample components can be achieved by two-dimensional development. In this process, the plate is developed normally and following complete drying, it is turned 90o and the development of the plate is continued. This second development is performed using a different mobile phase with very different selectivity (otherwise little further separation would result).
For example, plant phospholipids and glycolipids can be separated by first developing the plate in chloroform-methanol-water (75:25:2.5, by volume) in the first direction. After allowing sufficient time for drying, the plate is developed, at right angles to the first development, in chloroform-methanol-acetic acid-water (80:9:12:2, by volume). Schematic representation of two-dimensional TLC separation of complex lipids from A. thaliana. Abbreviations, MGDG, monogalactosyldiacylglycerols; DGDG, digalactosyldiacylglycerol; SQDG, sulfoquinovosyldiacylglycerol; DPG, diphosphatidylglycerol; PG, phosphatidylglycerol; PE, phosphatidylethanolamine; PI, phosphatidylinositol; PS, phosphatidylserine; and PC, phosphatidylcholine
Quantitative Analysis Quantification can be performed by manually scraping off the selected spots (analytes and standards) and analyzing them with GC, HPLC or other quantitative method. Analytes can also be measured by scanning the plates using an optical densitometricscanner with automatic sample application, and using HPTLC plates, quantification with a precision ranging from 1% to 3% can be achieved.
After development and drying, the rods are automatically passed through a specially constructed flame ionization detector (FID) at a constant speed. The result is a chromatogram similar to a normal HPLC chromatogram. Rod Thin-Layer Chromatography Instead of thin plates this method uses a thin layer of stationary phase coated onto small diameter quartz rods. The rods are spotted and developed in a similar manner to regular TLC plates
Molecules that are too large to enter into the pores of the beads are unretained by the column and are not separated. Molecules that are very small in relation to the pore size all behave similarly and these small molecules are also not separated. Medium sized molecules are separated based on how far they penetrate into the gel beads.
One of the earliest materials developed for size exclusion is still in use and is called Sephadex. Sephadex is made from dextran cross-linked (polymerized) with epichlorohydrin. Structure of Sephadex The gels can be manufactured with different amounts of cross-linking which will produce gels of different porosities and different ranges of molecular size separation.
Large molecules elute after a volume of mobile phase equal to the void volume Vo has passed through the column. Small molecules will elute with a volume of mobile phase equal to the void volume and pore volume (Vo + Vi ). Medium size molecules will elute between Vo and (Vo + Vi ).
Molecular Shape has an effect on the relationship between the molecular weight and retention.
Interactions between the stationary phase and the analytes should be avoided. Cationic adsorption effects can be reduced by the addition of mobile phases with an ionic strength of 0.05-0.1 M. Low pH (around 3) will also help reduce some stationary phase interactions. Methanol can be added to the mobile phase to reduce hydrophobic retention, and ethylene glycol may help reduce the adsorption of proteins.
Chiral Chromatography Chiral - adjective: not superimposable on its mirror image: used to describe a molecule whose arrangement of atoms is such that it cannot be superimposed on its mirror image. Enantiomers - noun: mirror-image molecule: either of a pair of molecules that are a mirror image of each other in structure but cannot be superimposed.
Chiral Chromatography Because of their chemical and physical similarity, enantiomers can be difficult to separate. However, they can be separated by chromatography, provided the system is also chiral. This can be achieved by the use of a chiral mobile phase, by a chiral liquid stationary phase or a chiral solid stationary phase.
Chiral Chromatography Mobile Phase The addition of chiral atoms to the mobile phase is one way to perform separations. If the chiral reagent form a complex of some type with one type of molecule of a pair of enantiomers, chiral separation may result.
Chiral Chromatography There are many solid stationary phases available. Brush type phases, cavity phases (such as cyclodextrins, crown ethers and macrocyclicglycopeptide antibiotics), protein phases, and ligand-exchange phases are common examples. Brush Type Stationary Phases.
Molecules such as these do not match the ligand and are not adsorbed Affinity Chromatography…. Is based on the interactions between two components that are ideally suited to each other both electrostatically and spatially. One component is bonded to a solid support. The bonded component interacts with the analyte and the analytes is adsorbed from the solution.
Affinity Chromatography Affinity chromatography is the most specific chromatographic method and the separation in based on biochemical interactions such as: • antigen antibody • enzyme inhibitor • hormone carrier
Affinity Chromatography Elution