Download
1 / 31
310 likes | 429 Views
How much did you drink this weekend?. 0 drinks 1-2 drinks 3-4 drinks 5-6 drinks >6. Upcoming work. HW #9 due next Monday Part 3 of Data Project due April 3 rd Quiz #5 in class next Thursday. Chapters 20 & 21. Testing Hypotheses About Proportions. ISU – Statistics (revised).

E N D
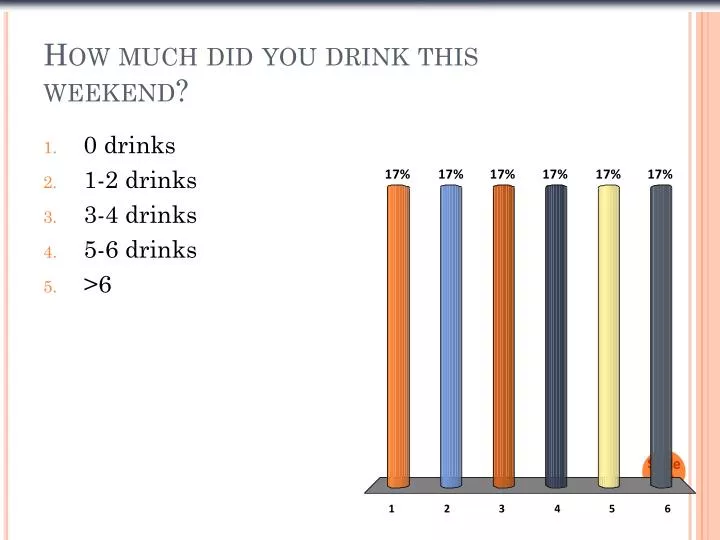
How much did you drink this weekend? • 0 drinks • 1-2 drinks • 3-4 drinks • 5-6 drinks • >6
Upcoming work • HW #9 due next Monday • Part 3 of Data Project due April 3rd • Quiz #5 in class next Thursday
Chapters 20 & 21 Testing Hypotheses About Proportions
ISU – Statistics (revised) • 61.3% of ISU students reported binge drinking in the previous two weeks • Sample size = 1,267 • Compared to other campuses 68.9%, believe the alcohol use at ISU is about the same. • Other campuses… • National results average about 45%
The Reasoning of Hypothesis Testing • There are four basic parts to a hypothesis test: • Hypotheses • Model • Mechanics • Conclusion • Let’s look at these parts in detail…
1. Hypotheses • The null hypothesis: To perform a hypothesis test, we must first translate our question of interest into a statement about model parameters. • In general, we have H0: parameter = hypothesized value. • The alternative hypothesis: The alternative hypothesis, HA, contains the values of the parameter we consider plausible if we reject the null.
1. Hypotheses • The null hypothesis: What we think is the truth. • We can only reject or fail to reject the null hypothesis. • The alternative hypothesis: If we are wrong about the truth (i.e. reject the null hypothesis), what must be true about the truth. • We can only reject or fail to reject the null hypothesis. • If we reject the null hypothesis, this suggests the alternative is true.
Possible Hypotheses • Two-tailed test • Ho: parameter = hypothesized value HA: parameter ≠ hypothesized value • One-tailed test • Ho: parameter = hypothesized value HA: parameter < hypothesized value • Ho: parameter = hypothesized value HA: parameter > hypothesized value
Is the coin in my hand a fair? • Ho p=0.5 Ha p>0.5 • Ho p=0.5 Ha p<0.5 • Ho p=0.5 Ha p≠0.5
In the 1980s only about 14% of the population attained a bachelor’s degree. Has the percentage changed? • Ho p=0.14Ha p>0.14 • Ho p=0.14Ha p<0.14 • Ho p=0.14Ha p≠0.14
Last year recycling rates were at 25%. The town of Trashville claims that the new mandate, requiring everyone to recycle, has increased the recycling rate. • Ho p=0.25Ha p>0.25 • Ho p=0.25Ha p<0.25 • Ho p=0.25Ha p≠0.25
In a rural area only about 44% of the well drilled find water.A local man claims to be able to find water by dowsing. You check 66 of his customers and find 23 of their wells have water. • Ho p=0.44Ha p>0.44 • Ho p=0.44Ha p≠0.44 • Ho p=0.35Ha p>0.35 • Ho p=0.35Ha p≠0.35
Testing Hypotheses • The null hypothesis specifies a population model parameter of interest and proposes a value for that parameter. • We want to compare our data to what we would expect given that H0 is true. • We can do this by finding out how many standard deviations away from the proposed value we are. • We then ask how likely it is to get results like we did if the null hypothesis were true.
2. Model • All models require assumptions, so state the assumptions and check any corresponding conditions. • Assumptions you will test • Independence • Randomization • 10% condition • Success/Failure • Determine Alpha Level
Alpha Levels • Result: • We do not prove or disprove hypotheses. • We only suggest that the likelihood of a hypothesis being true is very very low or high. • Null is probably true. • How rare is rare? 1%, 5%, 10% chance? • Common alpha levels are 0.01, 0.05, and 0.1. • The alpha level is also called the significance level. • When we reject the null hypothesis, we say that the test is “significant at that level.”
In a rural area only about 44% of the well drilled find water.A local man claims to be able to find water by dowsing. You check 66 of his customers and find 23 of their wells water. • Ho p=0.44Ha p>0.44 • Two possible conclusions: • Fail to reject null hypothesis at the 10% level, suggesting the local man finds water at about the same rate as simply drilling • Reject the null hypothesis at the 10% level, suggesting the local man finds water better than simply drilling.
3. Mechanics • The ultimate goal of the calculation is to obtain a P-value. • The P-value is the probability that the observed statistic value could occur if the null model were correct. • If the P-value is small enough, we’ll reject the null hypothesis. • Note: The P-value is a conditional probability—it’s the probability that the observed results could have happened if the null hypothesis is true.
The conditions for the one-proportion z-test are the same as for the one proportion z-interval. We test the hypothesis H0: p = p0 using the statistic where When the conditions are met and the null hypothesis is true, this statistic follows the standard Normal model, so we can use that model to obtain a P-value. One-Proportion z-Test
P-Values • The percentile associated with our z-value is called the p-value. • A p-value is a conditional probability • The probability of the observed statistic given that the null hypothesis is true. • The P-value is NOT the probability that the null hypothesis is true. • It’s not even the conditional probability that null hypothesis is true given the data.
Alpha Levels vs. P-value • We can define “rare event” arbitrarily by setting a threshold for our P-value. • The threshold is called an alpha level, denoted by . • If our P-value falls below that point, we’ll reject H0. • p-value < alpha level reject null • p-value > alpha level fail to reject null
In a rural area only about 44% of the well drilled find water.A local man claims to be able to find water by dowsing. You check 66 of his customers and find 23 of their wells water.Find the p-value of your test. • p=0.0668 • p=1-0.0668 • p=-1.50 • p=.3485
P-Values, again • The percentile associated with our z-value is called the p-value. • A p-value is a conditional probability • The probability of the observed statistic given that the null hypothesis is true. • The P-value is NOT the probability that the null hypothesis is true. • It’s not even the conditional probability that null hypothesis is true given the data.
Interpret the p-value 0.9332, from our previous example of water dowsing • If his dowsing has a better success rate than drilling, there is a 93.32% chance of seeing results as good as those of the dowser or better through repeated sampling. • If his dowsing has a worse success rate as drilling, there is a more than 93.32% chance of seeing results as good those of the dowser, or worse, through repeated sampling. • If his dowsing has the same success rate as standard drilling methods, the p-value is the probability of results as good as those of the dowser or better through repeated sampling
Rejecting the null • If we reject the null, the results of the alternative being true are said to be statistically significant. • Example, • During a jury trial the hypothesis test is • Ho: defendant is innocent • Ha: defendant is guilty • We must collect enough data to show Ho is not true. • For a court case: Guilty beyond a reasonable doubt. • If we reject the null, the alternative must be true. • For statistical: Data shows statistical significance in favor of the alternative hypothesis.
Failing to reject the null • You should say that “The data have failed to provide sufficient evidence to reject the null hypothesis.” • Don’t say that you “accept the null hypothesis.” • In a jury trial, if we do not find the defendant guilty, we say the defendant is “not guilty”—we don’t say that the defendant is “innocent.”
Example – water dowsing. (Consider an alpha of 0.05 as strong evidence) • We fail to reject the null hypothesis. There is evidence to suggest that the dowser has a success rate higher than 44% • We can reject the null hypothesis. There is evidence to suggest that the dowser has a success rate higher than 44% • We fail to reject the null hypothesis. There is NOT evidence to suggest that the dowser has a success rate higher than 44%.
4. Conclusions • We can only reject or fail to reject the null hypothesis. • If we reject the null, there is enough evidence to suggest the alternative is true, b/c the p-value is very very small. • If we fail to reject the null, there is NOT enough evidence to suggest the alternative is true, b/c the p-value is still large.
HW 9 _ Problem 11 • An airline’s public relations department says the airline rarely loses passengers’ luggage. • Claim: When luggage is lost, 85% is recovered and delivered to its owner with 24 hrs. • Survey of Air Travelers: 114 of 194 people who lost their luggage on that airline were reunited with the missing items by the next day
What is the correct hypothesis test? • Ho p=.59 Ha p>.59 • Ho p=.59 Ha p<.59 • Ho p=.59 Ha p≠.59 • Ho p=.85 Ha p>.85 • Ho p=.85 Ha p<.85 • Ho p=.85 Ha p≠.85
Do the results of the survey cast doubt on the airline’s claim of 85%? • No, because we do not reject the null hypothesis • Yes, because we reject the null hypothesis. • Yes, because we do not reject the null hypothesis • No, because we reject the null hypothesis.
Upcoming work • HW #9 due next Monday • Part 3 of Data Project due April 3rd • Quiz #5 in class next Thursday