Download
1 / 13
130 likes | 227 Views
SCAG Travel Model Improvement. Transportation leadership you can trust. Modeling Task Force Meeting. presented to Southern California Association of Governments presented by Maren Outwater, Cambridge Systematics, Inc. March 23, 2005. Status Report. Model development

E N D
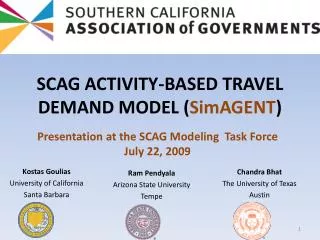
SCAG Travel Model Improvement Transportation leadership you can trust. Modeling Task Force Meeting presented toSouthern California Association of Governments presented byMaren Outwater, Cambridge Systematics, Inc. March 23, 2005
Status Report • Model development • Trip generation and vehicle availability (complete) • External trip models (complete) • Mode choice (underway) • Trip distribution (underway) • Model implementation and validation • Targets (complete) • Trip Generation (complete) • Trip Distribution and Mode Choice (underway)
Household Classification Models • Uses Census PUMS joint distribution of households to create joint distributions of SCAG socioeconomic data from marginal distributions • Estimates joint distributions of households • Workers/HH (4) by Age of Head of HH (4) by Household Size (4) • Persons/HH age 18-24 (3) by Income Group (4) • Persons/HH age 5-17 (4) • Persons/HH (4) by Income Group (4) • Workers/HH (4) by Income Group (4) by Household Size (4)
Trip Purposes Other-Based Other Home-Based Work, Direct 18% (21%) 16% (14%) Home-Based Work, Strategic Work-Based Other 4% (2%) 3% (11%) Home-Based School Home-Based Other 8% (9%) 16% (20%) Home-Based University/College Home-Based ServePassenger 11% 2% (3%) Home-Based Shopping Home-Based SocialRecreational 10% (9%) 11% (10%) Percent of Total Trips (2000 Model Validation)
External Trips • Expanded to match traffic counts • Estimated by time of day, mode and purpose • Person trips estimated from occupancy counts • Internal-external person trips subtracted from trip generation model
Trip Distribution • Calibrate new friction factors by trip purpose and time period (peak/off-peak) • Intermediate stop choice models will allocate home-based work strategic trips to intermediate stops after mode choice • Validation tests will include • Trip length frequency distributions • County to County trip tables • Percent of intra-zonal trips
Mode Choice • Compiled Six Surveys into a Single Estimation Dataset • Weighted using Weighted Exogenous Sampling Maximum Likelihood (WESML)
Mode Choice Model Development • Complete testing of level of service and demographic variables • Complete testing of model structure and nesting • Review and update models for FTA requirements
Project Completion • March-April • Complete Mode Choice Model Estimation • Calibrate Trip Distribution Models • Estimate Intermediate Stop Choice Models • May • Peer Review Panel Meeting • Implement New Mode Choice Models • Calibrate Mode Choice Models