Download
1 / 28
280 likes | 464 Views
ME 381R Fall Lecture 24: Micro-Nano Scale Thermal-Fluid Measurement Techniques. Dr. Li Shi Department of Mechanical Engineering The University of Texas at Austin Austin, TX 78712 www.me.utexas.edu/~lishi lishi@mail.utexas.edu. Visualization of Microflows. References:

E N D
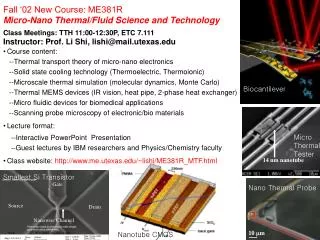
ME 381R Fall Lecture 24: Micro-Nano Scale Thermal-Fluid Measurement Techniques Dr. Li Shi Department of Mechanical Engineering The University of Texas at Austin Austin, TX 78712 www.me.utexas.edu/~lishi lishi@mail.utexas.edu
Visualization of Microflows • References: • A particle image velocimetry system for microfluidics, Santiago, J.G et al. Experiments in Fluids, 25, pp. 316-319. (1998) • 2. PIV measurements of a microchannel flow, Meinhart et al. Experiments in Fluids, 27, pp. 414-419 (1999) • 3. J.I. Molho, A.E. Herr, T.W. Kenny, M.G. Mungal, P.M. St.John, M.G. Garguilo, P.H . Paul, M. Deshpande, and J.R. Gilbert, "Fluid Transport Mechanisms in Microflui dic Devices", Micro-Electro-Mechanical Systems (MEMS), 1998 ASME International Mechanical Engineering Congress and Exposition (DSC-Vol.66) Caged fluorescence Micro Particle Image Velocimetry (mPIV)
Caged Fluorescence • Fluorescent dye chemically locked in a stable molecule until hit with Nd:YAG laser which “uncages” it. • Uncaged dye is pumped with Microblue diode pumped laser. • Fluorescence is imaged with CCD camera. • (Molho. Et.at. 1998)
Results Experiment matches prediction for uniform “plug flow” for some cases studied. No discernable boundary layers, but some diffusion. http://microfluidics.stanford.edu/caged.htm
More Results In other cases though, flow looks very much like a pressure-driven Poiseuille flow Electro-Kinetic Flow can actually induce a pressure gradient in a capillary flow and thus alter the basic flow structure http://microfluidics.stanford.edu/caged.htm
Comparison with CFD Electro-Osmotic flow is relatively simple to model with standard CFD solvers. For pressure driven micro-capillary flow, CFD predicts flow field remarkably well, as shown in comparison of experimental and computational results at left. (Molho et.al. 1998)
Particle Image Velocimetry (PIV) Cross-correlation • Seed flow with particles • Don’t affect fluid characteristics • Accurately follow the flow • Illuminate flow at two time instances separated by t (e.g. using Nd:YAG laser) • Record images of particle fields (e.g. CCD camera) • Determine particle displacement • Calculate velocity as V x/ t Velocity vector Interrogation windows 32x32 pixels, 0.6 x 0.6 mm Images from Tsurikov and Clemens (2002) Particle fields 1024 x 1024 pixels 21 x 21 mm Raw velocity field Mean velocity subtracted Turbulent velocity field
The Need for -PIV • The physics is not very clear in micro flows (e.g. surface tension) • Typical length scales of 1-100 m, traditional flow diagnostics cannot be employed • Most micro-flow measurements were limited to bulk properties of the flow like wall pressure and bulk velocity • PIV enables measurements of velocity field in two dimensions
Other efforts • Particle streak imaging by Brody et al. (1996) • Less accurate than pulsed velocimetry measurements • Lanzilloto et al. (1997) used X-ray micro-imaging of emulsion droplets • Emulsion is deformable, large and not a good tracker of the flowfield • Optical Doppler Tomographic imaging by Chen et al. (1997) using Michelson interferometry • Single point measurement
-PIV • Particles used must be small enough to • Follow the flow • Should not clog the device • They must also be large enough to • Emit sufficient light • Sufficiently damp out Brownian motion • Particles are tagged with a fluorescent dye; hence actually imaging the fluorescence • Elastic scattering measurements are more difficult to employ in the micro-scale • Inelastic scattering like fluorescence can be readily filtered out
-PIV • Errors in measurement due to Brownian motion when measuring velocities of 10 m/sec • Error induced by Brownian motion sets a lower limit on the time separation between the images
First -PIV system • Essentially a microscope imaging fluorescence from the seed particles From Santiago et al. (1998)
State of the art -PIV system http://microfluidics.stanford.edu/piv.htm From Meinhart et al. (1999)
Demonstration of -PIV • Hele-Shaw flow (Re=3e-4) • used the first -PIV system discussed before • Micro-channel flow • Uses the laser based system
Velocity fields: Hele-Shaw • Shows instantaneous and average images • Effect of Brownian motion goes away on averaging • Spatial resolution 6.9 m x 6.9 m x 1.5 m From Santiago et al. (1998)
Velocity Fields in a Micro-channel • Shows mean velocity profiles in a micro-channel • Measurements agree within 2% to analytical solutions From Meinhart et al. (1999)
Comparison to analytical solution From Meinhart et al. (1999)
Thermometry of Nanoelectronics Techniques Spatial Resolution Infrared Thermometry 1-10 mm* Laser Surface Reflectance 1 mm* Raman Spectroscopy 1 mm* Liquid Crystals 1 mm* Near-Field Optical Thermometry < 100 nm Scanning Thermal Microscopy (SThM) < 100 nm *Diffraction limit for far-field optics
Thermal Topographic Z T X X Scanning Thermal Microscopy Atomic Force Microscope (AFM) + Thermal Probe Laser Deflection Sensing Cantilever Temperature sensor Sample X-Y-Z Actuator
10 mm Microfabricated Thermal Probes Pt Line Tip Pt-Cr Junction Laser Reflector SiNx Cantilever Cr Line Shi, Kwon, Miner, Majumdar, J. MicroElectroMechanical Sys., 10, p. 370 (2001)
Thermal Imaging of Nanotubes Thermal 30 10 10 20 5 5 Height (nm) Height (nm) 30 nm 30 nm 10 0 0 0 -400 -200 0 200 400 -400 -400 -200 -200 0 0 200 200 400 400 Distance (nm) Distance (nm) Multiwall Carbon Nanotube Topography Topography 3 V m 88 A m m 1 1 m m Spatial Resolution V) m 50 nm Thermal signal ( Distance (nm) Shi, Plyosunov, Bachtold, McEuen, Majumdar, Appl. Phys. Lett., 77, p. 4295 (2000)
Low bias: Ballistic High bias: Dissipative (optical phonon emission) Metallic Single Wall Nanotube Topographic Thermal DTtip A B C D 2 K 0 1 mm
Ideal MOSFET VG>0
Thermal Circuit Particle transport theory Fourier’s law of heat conduction
Joule Heating inHigh-Field Devices Localized heat generation near the pinch-off point
Future Challenge: Temperature Mapping of Nanotransistors SOI Devices SiGe Devices • Low thermal conductivities of SiO2 and SiGe • Interface thermal resistance • Short (10-100 nm) channel effects (ballistic transport, quantum transport) • Phonon “bottleneck” (optical-acoustic phonon decay length > channel length) • Few thermal measurements are available to verify simulation results