Download
1 / 30
310 likes | 566 Views
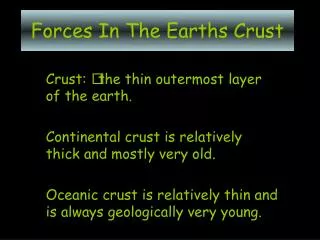
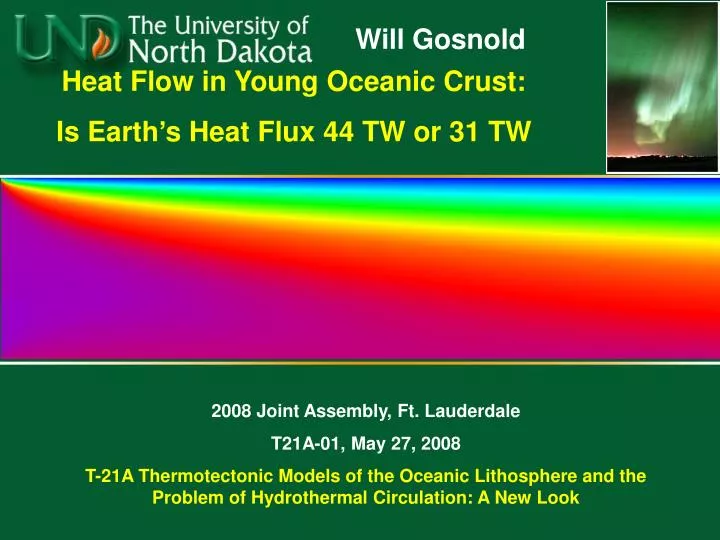
Will Gosnold. Heat Flow in Young Oceanic Crust: Is Earth’s Heat Flux 44 TW or 31 TW. 2008 Joint Assembly, Ft. Lauderdale T21A-01, May 27, 2008 T-21A Thermotectonic Models of the Oceanic Lithosphere and the Problem of Hydrothermal Circulation: A New Look. Outline. Statement of problem

E N D
Will Gosnold Heat Flow in Young Oceanic Crust: Is Earth’s Heat Flux 44 TW or 31 TW 2008 Joint Assembly, Ft. Lauderdale T21A-01, May 27, 2008 T-21A Thermotectonic Models of the Oceanic Lithosphere and the Problem of Hydrothermal Circulation: A New Look
Outline • Statement of problem • Heat flow data • Continental and marine heat flow • Heat flow vs. age models • 2-D numerical models • Sumary and conclusions
20,201 heat flow sites recognized by the International Heat Flow Commission
At issue is the accuracy of models of heat flow vs. age. q = 510 t -.5 q = 480 t -.5 q = 473 t -.5
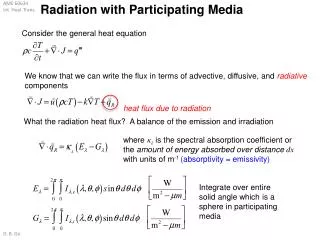
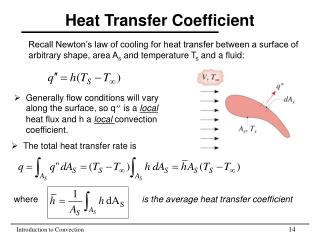
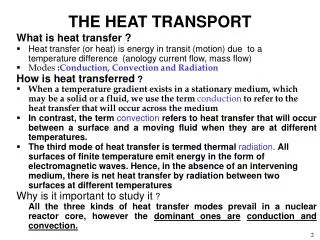
Surface Heat Flow Conductive heat flow at the surface is described by Fourier’s law of Heat conduction Assuming we know heat flow, temperature at depth “z” may be calculated by
Conductive heat flow is predictable Continental heat flow decreases with depth Sources are heat contained with the crust and mantle and radioactive heat production
In a conductive environment with constant heat flow, the temperature gradient varies with thermal conductivity.
A fundamental assumption is that the temperature gradient is vertical and heat flow calculated from the gradient is vertical heat flow.
Topography and complex structure with thermal conductivity contrasts or transient sources and sinks such as water flow invalidate this assumption.
Heat flow in conductive environments is predictable and the heat flow map of North America demonstrates this predictability on the continents and in the ocean basins. High heat flow: young crust and recent tectonics Low heat flow: old thermally stable crust
Variation in conductive heat flow within heat flow provinces on the continents is due to variation in radioactive heat production. q = q0+ AD
Continental heat flow exhibits low variability in non-tectonic areas. Variability of q vs distance east of the Rocky Mts.
Marine heat flow exhibits high variability everywhere. Variability of q vs distance from ridge
Bullard’s Law "Never take a second heat flow measurement within 20 km of the original for fear that it differ from the first by two orders of magnitude." Side-by-side comparison of marine and continental heat flow suggests the presence of non-conductive and transient signals in marine environments and in young tectonic environments.
2-D finite-difference heat flow model • Temperature profile for the ridge crest and intraplate from D.H. Green • Temperature at base of intraplate lithosphere 1370 C • Thermal conductivity profile from Hofmeister (1999) and van den Berg, Yuen, and Steinbach (2001) • Half-spreading velocities of 1, 2.5, 5,&10 cm y-1
Surface Temperature 0 C T = 1370 T = 1410 Base of Lithosphere = 1370 C
Thermal Conductivity: Hofmeister (1999); van den Berg, Yuen, Steinbach (2001) k0 = 4.7 WK-1m-1 T in deg K, P in Pa Gruenheissen Paramteter, γ = 1.2 Thermal expansion coefficient, α = 2.0 x 10⁻⁵ K-1 Bulk modulus, K0 = 261 GPa Pressure derivative of the bulk modulus, K0' = 5 The fitting parameter, a = 0.3
Each node in the model exchanges heat with its eight nearest neighbors in two processes: conduction and advection. Iteration time for each calculation is controlled to maintain stability in the model.
Surface Temperature 0 C T = 1370 T = 1410 Base of Lithosphere = 1370 C
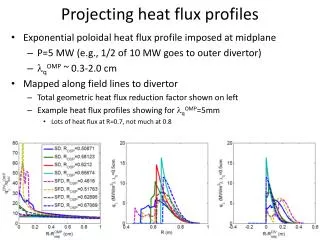
Temperature and heat flow gradient from ridge crest to 19 Ma (474 km @ 2.5 cm y-1)
HF at 0 Ma = 1577 mW m-2 HF at 0 Ma = ∞ HF at 0 Ma = ∞ HF at 0 Ma = ∞
Summary and conclusions • Conductive heat flow is predictable. • Side-by-side comparison of marine and continental heat flow suggests extreme non-conductive and transient signals in marine environments and in young tectonic environments. • To test analytical models of heat flow at ocean ridges, we created a 2-D finite-difference model of lithosphere spreading.
Summary and conclusions • The output of the model is a 2-D temperature-depth grid that provides a comparison with various analytical models of oceanic heat flow. • We tested the reliability of the computations using different half-spreading rates and different node spacings and verified that the models yield equivalent results at equivalent times and depths. • Our results show that the GDH1, HSC, and PSM models overestimate heat flow close to the ridge, but the differences are small. • Our model does not provide evidence that heat flow is less than 44 TW.
Heat is transported laterally by advection. Plates move at different rates at different times and heat flow is higher farther out in fast moving plates. • After 10 MA of not moving, the 12 km thick lithosphere lost all of its heat for advection. • Do separate segments of the plates move at different rates? • It is the difference in velocity at the ridge that matters because there is no other source of heat.