Download
1 / 35
350 likes | 442 Views
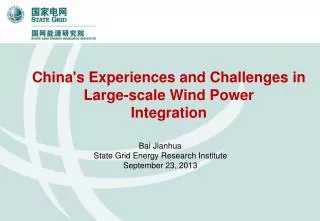
China's Experiences and Challenges in Large-scale Wind P ower Integration. Bai Jianhua State Grid Energy Research Institute September 23, 2013. Disclaimer:

E N D
China's Experiences and Challenges in Large-scale Wind Power Integration Bai Jianhua State Grid Energy Research Institute September 23, 2013 Disclaimer: The views expressed in this document are those of the author, and do not necessarily reflect the views and policies of the Asian Development Bank (ADB), its Board of Directors, or the governments they represent. ADB does not guarantee the accuracy of the data included in this document, and accept no responsibility for any consequence of their use. By making any designation or reference to a particular territory or geographical area, or by using the term “country” in this document, ADB does not intend to make any judgments as to the legal or other status of any territory or area.
(1) The situation of wind power integration By the end of 2012, China's installed capacity of wind power integrationtopped the world, reaching 60.83 million KW. Installed capacity of wind power China US Germany Spain India France Italy UK Canada Portugal Comparison of Top 10 Countries in Wind PowerInstalled Capacity 4
From 2006 to 2012, China‘s wind power has increased from 2 million KW to 60 million kW, with expanded scale and advanced technology. 10MW NW East of China China's Wind Power Integration Capacity Central China NE North China China's Wind Power IntegrationCapacity from 2006 to 2012 (10MW) Wind Power IntegrationCapacityby Region in 2012 (10MW) 5
76% By the end of 2012, the installed capacity of wind power integration in SGCC's operating areas has increased to 56.76 million kWwithan average annual growth rate of 76% since 2006. Installed wind power capacity growth rate China US Germany Spain Denmark Wind powerintegration capacity in SGCC's operating areas from 2006 to 2012 Comparison of Typical Countries in Installed Wind Power Capacity Growth Rate The wind power integrationcapacity of the SGCC is the largest-scale in the world and increases at the fastest rate. 6
(2) Operational situation of wind power Wind power generating capacity of SGCC's operating areas in 2012 increased to 96.8 billion kWh at the average annual growth rate of 85%, almost 41 times as much as that in 2006. 85% Wind power generating capacity of SGCC's operating areas from 2006 to 2012 7
Wind power utilization hours in SGCC‘soperating areas from 2006 to 2012 respectively reached 1917, 2015, 2004, 1993, 2095, 1928, and 1903 hours. There was “wind curtailment”in recent years. Wind power utilization hours Wind power utilization hours SGCC's operating areas Spain Germany Denmark Comparison between domestic and international wind power utilization hours in 2012 Wind power utilization hours in SGCC's operating areas 8
黑龙江 吉林 辽宁 内蒙古 新疆 宁夏 青海 甘肃 陕西 河南 安徽 西藏 湖北 四川 重庆 江西 湖南 贵州 台 湾 云南 广西 海南 (1) Wind energy resource and power load distribution • China‘s onshorewind energy resourcesaremainly in the “Three Norths”( Northwest, Northeast & North China) , accounting for more than 90% of China's total wind energy resources. It is planned that the installed wind power capacity in “Three Norths” in 2015 and 2020 will reach 79 million kWand 164 million kWrespectively, accounting for 80% of theplanned total . • Two thirds of thepower load in China is concentrated in the eastern and central regions. China‘s wind energy resource distribution map China's power load distribution map 10
Installed wind power capacity in western Inner Mongolia, eastern Inner Mongolia, Gansu, and northern Hebei, the four regions with the largest installed wind power capacity, accounts for about 50% of national total, but electricity consumption there only accounts for about 10%. Due to small electricity load, it is difficult for most of wind farms to consume locally. % of wind power generation in national total % of wind power consumption in national total Western Inner Mongolia Eastern Inner Mongolia Gansu Northern Hebei Total Wind power integration is not only about connection, but also about output and consumption. 11
(2) Peak regulation in the system • Wind power is characterized by intermittence, randomness, and volatility. Efficient use of wind power requires adequate support in peak regulation from conventional power source. Large-scale development and efficient consumption of wind power has become a global problem. • As China's primary energy is coal-based, and the power mix in “Three Norths” where wind power is concentrated is single, in which thermal power accounts for 80%, heat-supply units take a large proportion, and power source for flexible adjustment such as fuel, gas and pumped storage power takes less than 1%, the ability of peaking regulation is limited, particularly in the heating period in winters. NE North of China NW Total of “Three Norths” Flexible power (pumped storage, fuel and gas) Wind power Others Hydro Coal Power mix in "Three Norths" 12
The power resource withflexible regulation in Spain accounts for 34%, 1.7 times ofwind power. • That in U.S. accounts for 49%, 14 times of wind power. • A higher proportion of flexible power resourceis one of the main reasons why Spain and other countries are at a high level of wind power utilization. • The power resource withflexible regulation in China only accounts for 5.6%, 1.1 times ofwind power. China Spain Germany US Flexible power (pumped storage, fuel and gas) Wind power Others Hydro Coal Comparison Diagram of Power Mix 13
Locally: Installed wind power capacity in “Three Norths”has reached 20%. Subject to small-scale market, limited resources for peak regulation, and lack of a capacity of trans-regional transmission, there is no space for further wind power development. Nationally:Installed wind power capacity accounts for only 5%. Resources for peak regulation are relatively abundant in the eastern and central regions; the consumption market has not been fully developed. NE NW Tibet “Three Chinas” Grid South China China‘s realities of reverse distribution between wind power and other new energy and load determine that China's new energy should focus on large-scale development and long-distance outbound delivery. 14
(1) Objectives of wind power development plan According to the 12th Five-Year Plan for Wind Power Development issued by National Bureau of Energy of China in July 2012, there will betotal of 100 million kWinstalled wind power capacity by the end of 2015, with annual wind power generating capacity reaching 190 billion Kwh; by 2020, there will be a total of 200 million kW installed wind power capacity,with annual generating capacity reaching 380 billion kWh. Wind power installation (million kW) % of wind power in installation Million kW Installed Wind Power Capacity in National Planning 16
黑龙江 Eastern Inner Mongolia Jilin 吉林 Kumul 内蒙古 辽宁 Hebei 新疆 Western Inner Mongolia Jiuquan 京 津 Shandong 河北 山西 宁夏 山东 Costal area of Jiangsu 青海 甘肃 陕西 江苏 河南 西藏 安徽 上海 湖北 浙江 四川 重庆 江西 湖南 福建 贵州 台 湾 云南 广西 广东 香港 澳门 海南 Heilongjiang (2) Large-scale wind power base China‘s wind power development is generally characterized bycentralized development with the support of distributive development, relying mainly on onshore wind with the support of offshore wind power, and attaching equal importance to local consumption and trans-regional transmission. According to the distribution characteristics of wind energy resource, China plans to construct a number of large wind power bases, including Kumul, Jiuquan, Western Inner Mongolia, Hebei, Eastern Inner Mongolia, Jilin, Shandong and coastal area of Jiangsu, Heilongjiang, etc. Schematic diagram of large-scale wind power bases distribution 17
Installed capacity planned of provinces According to the 12th Five-Year Plan for Renewable Energy Development and provincial planning, a table of installed capacity in various regionsis developed (see the table) . China will maintain Three-Norths-based wind power development layout for a long time. The wind power development in 10 provinces in “Three Norths” regionaccounts for about 80%. The wind power decentralized development in the eastern and central regions is oflimited-scale. 18
(1) Coordinated solution to wind power integration & consumption Good power supply structure, and increasing the flexible power supply for peak regulation in the system are the important foundation to raise the consumption capacity of wind power. Incorporate the wind power large-scale development, transmission and consumption into the unified planning for power development, is the important guarantee to raise the consumption capacity of wind power. Power structure Coordinated planning Grid layout 可再生能源发电 Construct strong interregional large power grid is objective need to raise the consumption capacity of new energy power generation market Renewable energy power generation Electricity consumption structure Technical standards and norms Formulatethe strict integration technical standards and management norms is the basic to raise the consumption capacity of wind power. Mobilize a wider range of demand side resources to participate in the system adjustment, is an effective way to improve the consumption capacity of wind power . Improve overall capacity of electricity system receiving electricity from new energy 20
To fulfill the objective of national wind power's new energy planning development, the tasks are arduous and the management and technology are extremely complex. To make sure healthy and renewable development of new energy and wind power integration, it is needed to coordinate the whole power system comprehensively and optimize resources allocation while taking the larger picture into consideration. 21
(2) Overall system optimazation for wind power and other clean energy development Principles of overall system planning for wind power Safety:satisfying the system‘s max load (electricity balance) ; the min load (peak ragulation balance) ; hourly eolectricity balance (load tracing) Cleaniliness:fulfilling the objective of the total amount of national wind power and other clean energy development and expanding the scale of wind power development Economics:reasonablly planning other power and trans-province power grid, and minimizing the total costs like system investment, operation and external cost, etc. High efficiency:optimizing the system operation, improving the system's intelligent level, lowering the running cost and decreasing the consumption of fossil energy 22
Overall design of clean energy development • Scenario construction: considering national energy strategy; coordinating supply and demand balance of coal, gas and electricity; forming electric power development scenario by combining power planning • Scenario analysis: analyze the electricity and layout ,running method and development and consumption situation of clean energy power under different development scenarios • Benefit evaluation: evaluate quality of all development scenario to provide the basis of the route of fulfilling the objective of clean energy and suggestion for formulating the energy strategy and related industry planning Electric power development scenario construction Energy strategy and relevant industry planning Optimization of multi-regional power Overall development scenario of the energy power Electric power development boundary conditions Model for overall optimization and planning of power system Energy development goals Coal and transportation industry planning Oil & gas industry planning Renewable energy development planning Production stimulation of power system Analysis/Verification of system frequency adjustment Revision suggestions Development quality and benefits evaluation conclusion Development evaluation Overall cost CGE Model Evaluation system Economic benefits Social benefits IO Model 23 Environmental benefits Overall design thinking of clean energy, conventional energy and power system 23
Build a coordinating development model for energy resource and power generation to adapt to the energy mix and adjust the target • Optimization of multi-regional energy resource: optimize the scale and layout of all kinds of power development as the input condition of renewable energy consumption plan computing • Power system output stimulation : optimize the operational model of the power system accommodating renewable power generation, the consumption method of wind power and other renewable energies and hydro and wind curtailment level. • Analysis/Verification of system frequency adjustment: identify the impact of the development and consumption plan for wind power and other intermittent power on the stability of system frequencyand adjust the consumption plan for wind power and wind curtailment level. I. Optimization of multi-regional power 1. Identify the scale and layout for non-fossil energy power development 2. Optimize the scale and layout for power and power flow in various regions 3. Identify the total costs and composition of power system 4. Emission scale and layout of environmental pollutants and CO2 Adjusting wind power consumption plan and electricity level of wind and solar curtailment II. Production stimulation of power system 1. Identify the operating curve of various power including wind power 2. Identify the operating curve of trans-provincial connection line 3. Identify wind and solar curtailment and fuel consumption CO2 No Whether there exist acceptable limits in wind and solar curtailment levels in various regions III. Analysis/Verification of system frequency adjustment 1. The overall situation of system frequency adjustment capacity and evaluation 2. Adjust wind power consumption plan and wind and solar curtailment level Yes Plan for output power planning scenario 24
Most grids in China's wind power bases are small in scale and insufficient in wind power consumption capacity, and the large-scale development and high-efficient use must rely on long-distance, large-volume and trans-regional delivery. • Northwest: in addition to consumption in the northwest grid, Xinjiang’s and Gansu’s wind power needs to transmit to “Three Chinas (East China, North China, Central China)"receiver-sidegrid at a large scale. • Northeast: based on taking full advantage of all regions'consumption and trans-provincial adjustment, it needs to deliver to " Three Chinas". • Western Inner Mongolia: apart from consumption within the region, wind power should be delivered to “Three Chinas" receiver-side grid . • Wind power fromHebei, Shandong and Jiangsu coordinately consumes within “Three Chinas"grid. Heilongjiang Northeast Eestern Inner Mongolia Jilin Liaoning Western Inner Mongolia Xinjiang Ningxia Hebei Gansu Northwest Shandong Shanxi Jiangsu 西 藏 “San Hua“ region receiver-side grid South (3) Wind power flow pattern
According to the plan , by 2020, the national wind power development scale will reach 200 million kW. Wind power consumption within the province will reach 96 million kW, trans-provincial consumption 14 million kW within regional grid and trans-regional grid consumption 90 million kw. Trans-provincial trans-regional consumption will amount o 50% by then, then the proportion of wind curtailment can be controlled below 5%. Trans-regional delivery Trans-provincial delivery Intra-provincial consumption Sichuan, Chongqing and Tibet Western Inner Mongolia South NE (Eastern Inner Mongolia) NW Shanxi Central and eastern region receiver-side Proportion wind power consumption in main regions in 2020 26
To promote efficient use of clean energy like wind power, sending and receiver-side of the power grid have to satisfy the requirements of high-efficient integration and coordinated operation among various energies. • With increasedscale of trans-regional power flow, the receiving propotion in receiver-side regions such as Beijing, Tianjin, Hebei and Shandong, four eastern provinces of Central China and East China will be increased and the running complexity of power system will be greater in the future. • There are higher requirements for resource allocation capabilities and coordinated operation platform functions of sending and receiver-side power grids, eg, requirelarger coverage and strong grid structure and further improved dynamic balancing ability and greater safety and stability level. 27
Base load of external power Minimum output of conventional coal power Medium load of external power Pumped storage PV Solar curtailment Heat supply units Hydro Regulating output of conventional coal power Wind power Wind curtailment Wind power Thermal power Connection line Direct current delivery Hours Sending side running curve Receiver side grid running curve 28
Jiuquan Currently, specialized plannings for national renewable energy sources, wind power and photovoltaic power have been issued, while transmission channels of new energy bases have not been implemented yet, including Xilingol League-Nanjing and Western Inner Mongolia- Changsha UHV AC power transmission projects targeted at Western Inner Mongolia wind power, and Jiuquan-Hunan, HulunBuir-Shandong, Zhangbei-Nanchang UHV power transmission projects targeted at northwest, northeast and Zhangjiakou respectively. Hunan Xilingol League-Nanjing Western Inner Mongolia -Changsha Jiuquan-Hunan 29
(4) The technical and economical problem of wind power delivery Ways of wind power transmission Way 1 Separate transmission of “coal or wind power" Sending–side wind power is transmitted to the receiver side through long distance line. Sending–side coals supply to coal plants in the receiver side through long-distance railway transmission, and the average tariff in the receiver-side grid will be measured based on the ground tariff and feed-in tariff. Way 2 "Coal and wind power" combined transmission Sending–side combined wind power and coal power to be transmitted to the receiver side through long distance line, and the ground tariff of receiver-side grid will be calculated. Sending-side grid Sending-side grid Receiver-side grid Wind power Receiver-side grid Wind power Transmission line Coal Thermal power Transmission line Coal Thermal power Railway Measuring point Measuring point Way 2 "Coal and wind power" combined transmission Way 1 Separate transmission of “coal or wind power” 30
Using coal power channel to transmit clean energy like wind power, improve the economics and safety of transmission and promote the large-scale development of clean energy. • Xinjiang, Erdos, Xilingol League areas are quite rich in wind energy and coal resources with close distribution, which has good conditions for combined transmission. The main way for transmission of clean energy is joint delivery of wind, solar and coal. • In Eastern Inner Mongolia and Northeast areas with poor overlapping distribution of wind power and coal resources and limited delivery capacity of conventional energy in some areas, wind power-centered delivery method can be explored and demonstrated as the possible way for large-volume clean energy transmission under the premise of technical feasibility. 31
Combined delivery way Wind power-centered delivery way Thermal power Wind power Wind curtailment Thermal power Wind power Wind curtailment • Small scale wind power transmission, dominated by coal power and complemented by wind power • Controllable transmission power curve, better matching with receiver-side load • More utilization hours, and low transmission cost • About 5% of wind curtailment • 100% capacity replacing benefits • Large scale wind power transmission, dominated by coal power and complemented by wind power • Bigger fluctuation of transmission power • Less utilization hours, and high transmission cost • about 10% of wind curtailment • Less capacity replacing benefits 32
Adjusting energy structure and coping with climate change are the main direction for China's energy development. Vigorously developing clean energies, such as wind power and solar power is the significant measure to promote China's energy structure adjustment, ensure the safety of energy supply and coordinate the development of energy and environment. The development of China's wind and solar power and electricity consumption center presents reverse distribution situation, which determines that it is a must for accelerating the construction of trans-provincial power transmission channel and promoting the large-scale power transmission from "Three Norths" while developing such peak regulating power as pumped storage power, gas filed power plant and so on; Meanwhile, it also requires to strengthen the interconnection of North China-East China and Central China-receiver-side grid so ad to provide a larger market platform for accepting external wind power. In addition, it also needs strengthening the construction of distribution system to support the development of distributed power. 34