Download
1 / 36
360 likes | 491 Views
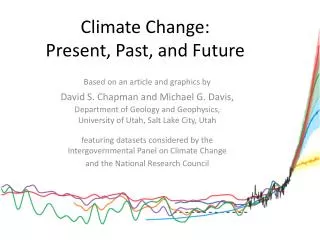
International Conference on Environmental Observations, Modeling and Information Systems ENVIROMIS-2004 17-25 July 2004, Tomsk, Russia. Modeling of present and assessing of future climate variations in Siberia V.N. Lykosov, Institute for Numerical Mathematics,

E N D
International Conference on Environmental Observations, Modeling and Information Systems ENVIROMIS-200417-25 July 2004, Tomsk, Russia Modeling of present and assessing of future climate variations in Siberia V.N. Lykosov, Institute for Numerical Mathematics, Russian Academy of Sciences, Moscow E-mail: lykossov@inm.ras.ru
The central direction of the climate sensitivity studies: mathematical modeling Problems: 1. The identification of models by sensitivity. 2. Is it possible to determine the sensitivity of the climate system to small external forcing using single trajectory?
Response to the increasing of CO2 CMIP models (averaged) INM model
Analysis of some extreme weather situations in Russia for the present-day climate and under CO2 doubling E.M. Volodin Institute for Numerical Mathematics, Russian Academy of sciences, Moscow E-mail: volodin@inm.ras.ru
DJF T(2m) – NCEP observed DJF T(2m) – INM simulated JJA T(2m) – NCEP observed JJA T(2m) – INM simulated Present-day climate
Max positive DJF T(2m) anomaly observed Max positive DJF T(2m) anomaly simulated Max negative DJF T(2m) anomaly observed Max negative DJF T(2m) anomaly simulated Present-day climate
DJF averaged DJF most warm DJF mostcold T(2m) climate change under CO2 doubling
JJA averaged JJA most warm JJA most cold T(2m) climate change under CO2 doubling
DJF precipitation observed DJF precipitation simulated JJA precipitation observed JJAprecipitation simulated Present-day climate
Normalized RMSD of precipitation DJF - observed Normalized RMSD of precipitation DJF - simulated Normalized RMSD of precipitation JJA - observed Normalized RMSD of precipitation JJA - simulated Present-day climate
DJF JJA Precipitation climate change (normalized) under CO2 doubling
Preliminary conclusions • The INM climate model quite well reproduces the present-day climatic distribution of themperature and precipitation as well as their seasonal variability and climatic extremes • When CO2 is increasing, winter extremes are, in general, less intensive • However, summer extremes (caused by positive anomalies of the air temperature and decreased amount of precipitation) are more intensive in the southern part of Russia and less intensive in the northern Russia. • The increase of northern precipitation and the decrease of southern precipitation is mainly caused by increase of the Arctic Oscillation index.
Sensitivity of the climate system to small perturbations of external forcing(invited lecture at the World Climate Conference, Moscow, 29 September – 3 October, 2003) V.P. Dymnikov, E.M. Volodin, V.Ya. Galin, A.S. Gritsoun, A.V. Glazunov, N.A. Diansky, V.N. Lykosov Institute of Numerical Mathematics RAS, Moscow
The Arctic Oscillation (constructed using NCEP/NCAR data and output of AGCM of INM RAS) AO (1EOF of surface pressure) calculated using DJF NCEP/NCAR data AO (1EOF of surface pressure) calculated using output of AGCM of INM RAS
Mathematical theory of climate • 1. Formulation of model equations • 2. Proof of the existence and uniqueness theorems • 3. Attractor existence theorem, dimension estimate • 4. Stability of the attractor (as set) and measure on it • 5. Finite-dimensional approximations and correspondent convergence theorems
Mathematical theory of climate (sensitivity) 6. Construction of the response operator for measure and its moments (“optimal perturbation”, inverse problems,….) 7. Methods of approximation for 8. Numerical experiments
Response operator for 1st moment (linear theory) Linear model for the low-frequency variability of the original system: ( A is stable, is white noise in time) Perturbed system
Stationary response For covariance matrix we have and response operator M could be obtained as
Numerical experiments Construction of the approximate response operator (A.S.Gritsoun,G.Branstator, V.P.Dymnikov, R.J.Numer.Analysis&M.Model, (2002), v.17,p. 399)
Reconstruction of the CCM0 response to the sinusoidal heating anomaly
Reconstruction of the low-level heating anomalies using the inverse response operator
Procedure for the construction of the approximate response operator is analogues to(A.S.Gritsoun, G.Branstator, V.P.Dymnikov, R.J.Numer. Analysis&M.Model, (2002), v.17,p. 399) Optimal perturbation for AO (1EOF of PS) calculated using NCEP/NCAR reanalysis data (zonal average) Optimal perturbation for AO (1EOF of PS) calculated using output of AGCM of INM RAS (zonal average)
Some questions on assessment of climate change impact on regional environment • RAS/NASA Northern Eurasia (NEA) Earth Science Partnership Initiative (NEESPI): - are mathematical models capable of simulating observed climate changes in NEA and their feedback effects on global climate? - what are the direct and feedback effects on environmental changes in NEA on the Earth climate system? • Permafrost changes in Siberia may have a substantial effect on the chemical deposition of the atmosphere such as carbon dioxide and methane • Are stand-alone permafrost models forced by climate change scenarios produced by global climate models (which, in general, do not describe explicitly processes in the frozen ground) capable of correct assessing environmental changes in Siberia?
Thermodynamics of shallow reservoir 1) One-dimensional approximation. 2) On the upper boundary: fluxes of momentum, sensible and latent heat, solar and long-wave radiation are calculated On the lower boundary: fluxes are prescribed 3) Water and ice: heat transport Snow and ground: heat- and moisture transport Ea S U Es H,LE Snow “Upper” ice Water “Lower” ice Ground U – wind velocity H – sensible heat flux LE – latent heat flux S – shirt-wave radiation Ea – incoming long-wave radiation Es – outgoing long-wave radiation
Mathematical formulation - for water and ice: , -heat conductivity - for snow: -temperature - liquid water - for ground: - temperature - liquid water - ice
Atmospheric forcing - air-water interface: - empirical formula for radiative fluxes - sensible and latent heat fluxes from the Monin-Obukhov similarity theory Routine observational data set on meteorological stations is used
Simulated snow cover depth for station Valdai(February – April, 1977)Contours: snow density
Snow cover height in Yakutsk: 1970/71 (а), 1971/72 (б), 1972/73 (в).
Simulated (solid) and observed (Franklin Bluffs, Alaska – dotted) ground temperature at depth 40 cm and 80 cm for 1988 (top) and 1990 (bottom) time period
Instead conclusion:THANK YOU for YOURATTENTION