Download
1 / 1

E N D
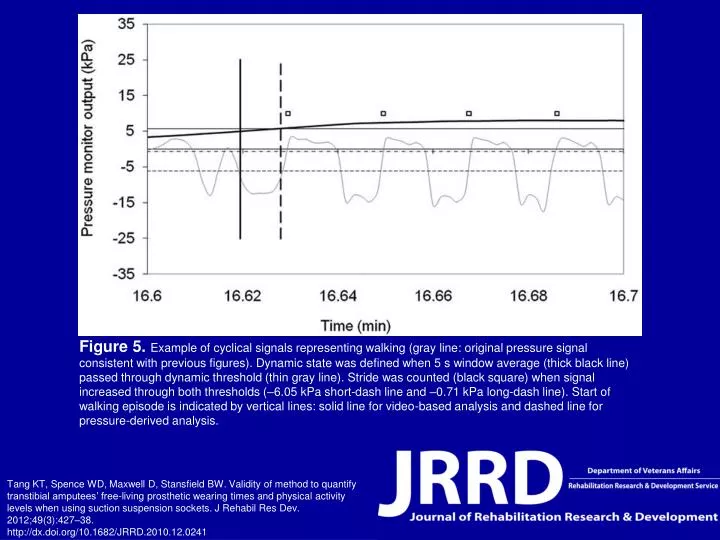
Figure 5. Example of cyclical signals representing walking (gray line: original pressure signal consistent with previous figures). Dynamic state was defined when 5 s window average (thick black line) passed through dynamic threshold (thin gray line). Stride was counted (black square) when signal increased through both thresholds (–6.05 kPa short-dash line and –0.71 kPa long-dash line). Start of walking episode is indicated by vertical lines: solid line for video-based analysis and dashed line for pressure-derived analysis. Tang KT, Spence WD, Maxwell D, Stansfield BW. Validity of method to quantify transtibial amputees’ free-living prosthetic wearing times and physical activity levels when using suction suspension sockets. J Rehabil Res Dev. 2012;49(3):427–38.http://dx.doi.org/10.1682/JRRD.2010.12.0241