Download
1 / 25
250 likes | 324 Views
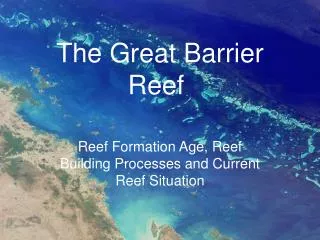
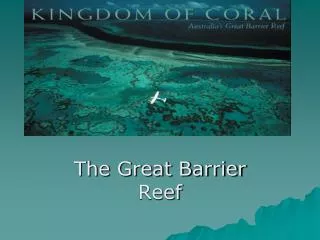
Scale and Scope issues in Great Barrier Reef. John Rolfe Jill Windle Jeff Bennett. GBR. Major biodiversity and recreation icon Large scale extends along most of Qld Coast (4 main sections), 2900 different reefs, about 6% of area covered by reef Extensive scope

E N D
Scale and Scope issues in Great Barrier Reef John Rolfe Jill Windle Jeff Bennett
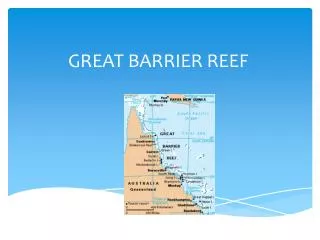
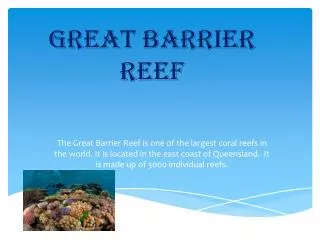
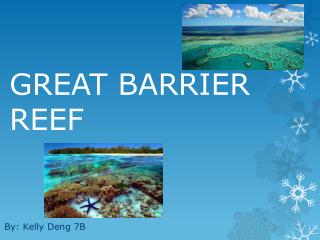
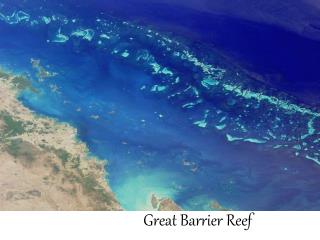
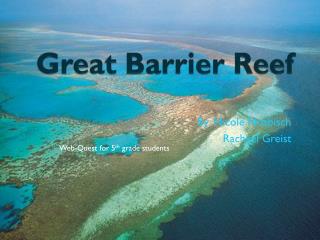
GBR • Major biodiversity and recreation icon • Large scale • extends along most of Qld Coast (4 main sections), • 2900 different reefs, • about 6% of area covered by reef • Extensive scope • Different assets – reef, fish, seagrass, mammals • Different areas – reef, beaches, islands, inner+outer • Different uses – biodiversity, fishing, recreation
Valuation challenges • Scale challenges • Changes in geographic scope referred to as a scale issue • Can values estimated at larger scale be transferred to smaller scale and vice versa • Whole reef → regional areas → local reefs • Scope challenges • Do values for key reef assets (fish + corals) change when more GBR assets are considered? • Marine mammals, beaches, seagrass, biodiversity
Scale issues • Two very separate reasons why small scale may generate higher values than large scale • Queuing effect means that respondents focus on the task that is offered to them • May assign higher values because issue is first in the queue – but lower values to following ones • Extrapolating from smaller scale to larger scale may be problematic • Task is to identify how values at larger scale can be apportioned
Proximity effect • Proximity effect would normally generate higher values for closer assets • Values for assets in close proximity may not be transferable or expandable to full region • Care has to be taken in offering smaller scale sets because both proximity and queuing effects may be present
Examples from previous studies • National Audit (van Beuren and Bennett) • Showed significant adjustments between regional and national frames • Fitzroy studies (Rolfe, Windle, Bennett) • Showed no significant difference between values for catchments and subcatchments
Potential tests for scale - 1 Type 1: (the traditional approach) • Split sample tests for CM conducted at different scales, but … • Difficult to change scale for some types of attributes – e.g. number of species • May be difficult to make a small scale focus a realistic choice task (how do respondents frame these)
Potential tests for scale - 2 • Type 2 – making the framing tradeoff explicit – similar to hypothetical statement • Not always clear that respondents stick to the frame they are being asked to consider • The Kakadu story • The ‘success’ of BT tests • Focus on a smaller scale tradeoff, but make it explicit to respondents that the results will be relevant to a wider set
Setting the scale framework • ‘You will now be presented with some tradeoffs relating to a section of the Great Barrier Reef. We will use the information to help set policy in the whole GBR region, so please keep in mind that your answers need to relevant to the full region’ • You will now be presented with some tradeoffs relating to a section of the GBR. We are dealing with other sections of the GBR separately, so please do not consider issues outside of the section that you are being asked to focus on’
Potential tests for scale - 3 • Run separate CM experiments at different scales in the same questionnaire • Full GBR survey • Regional or Local GBR survey • ‘We are going to present some options for GBR protection in two main formats. First, we will give you some choices focused on the whole GBR. Then we will give you some choices focused on a smaller area within the GBR’.
Issues with the dual survey approach • Estimate models for the two ‘splits’ separately? • Estimate models for the two ‘splits’ together by adding a dummy variable to identify the scale? • Coefficient for the dummy variable will identify the adjustment factor needed to adjust scales • Is it transferable to other contexts where different scales have not been presented so explicitly to respondents?
Potential tests for scale - 4 • The post-hoc disaggregation approach • Run single CM experiment over large-scale GBR • Then ask respondents to disaggregate values over different areas (e.g. regions) using other techniques • Budget framing exercises
Respondents have to allocate values between sections to 100%
Scope issues • Possible to scope the GBR in different ways • Coral reefs + fish • Coral reefs + fish + marine mammals • Coral reefs + fish + MM + beaches and estuaries • Are values for additional attributes additive?
Input measures • In the GBR, the input measures used to achieve protection may be very important • Values for protection may depend on how it will be implemented • Key input measures to consider • Improving water quality from agriculture • Reducing commercial & recreational fishing • Green zones • Controlling tourism impacts • Climate change measures
Input measures - 2 • Varying relationships between input measures and different attributes • Improving WQ from agriculture better for estuaries and corals • Reducing fishing better for fish • Different levels of uncertainty • Fishing and green zones - low • Agricultural WQ – medium • Greenhouse reduction – very high
The labelled approach • One option is to label the input measures • Allows information about levels of uncertainty to be associated with the label
The attribute approach • Include other information as attributes • Type of input (control action) • Certainty of achievement
The shopping basket approach • First, define improvements by input measure • Then give choice sets with different combinations of input measures + price • 2 units of WQ + 1 green zone @ $200 • 2 units of green zone + 1 fishing restriction @ $300 • Total sum of improvements for each alternative can also be shown on the choice set