Download

1 / 24
240 likes | 353 Views
ENERGY STAR HVAC Quality Installation Program. March 11, 2008. % of Cooling Delivered. 100%. 95%. 90%. 85%. Cooling Delivered. 80%. 75%. 70%. 65%. 60%. Quality Installation. Low airflow. Low Airflow +. Low Airflow +. Improper Charge. Improper Charge +. Duct Leakage.

E N D
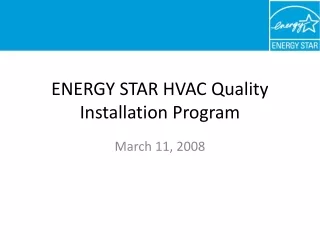
ENERGY STAR HVAC Quality Installation Program March 11, 2008
% of Cooling Delivered 100% 95% 90% 85% Cooling Delivered 80% 75% 70% 65% 60% Quality Installation Low airflow Low Airflow + Low Airflow + Improper Charge Improper Charge + Duct Leakage Potential Losses per Installation • Air Flow over Indoor Coil (70% inadequate) • Refrigerant Charge (62% improperly charged) • Equipment Sizing (50% oversized) • Duct Leakage is significant (Total leakage averaged 35% in the pilots) Source: C. Neme, J. Proctor, S. Nadel, National Energy Savings Potential from Addressing Residential HVAC Installation Problems, 1999 Installation issues reduce capacity by up to 30 percent! Or put another way… a SEER 13 performs like a SEER 10
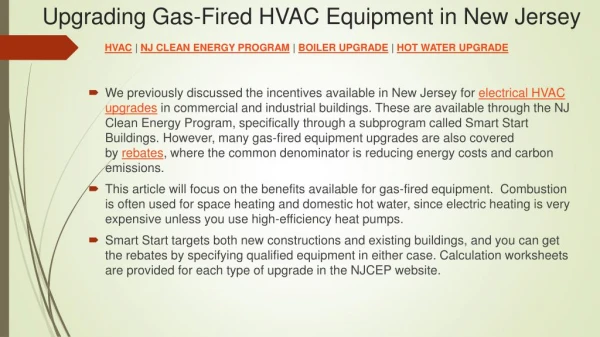
The HVAC Market • More than 53 percent of all existing homes have central air conditioning (Source CEE) • Four out of five new homes constructed today are built with central air conditioners (Source CEE) • In 2006, 7,069,296 unitary air conditioners and heat pumps were shipped from U.S. factories (Source ARI) • ACCA estimates that 60% to 70% of the shipments were for replacement • Reason for System Replacement (Source Decision Analyst) • 49% due to system failure • 39% planned replacement
How HVAC QI Meets Utilities' Goals • Average estimated savings from HVAC QI • Estimated peak electricity demand savings • Assumptions: • New system corrects typical install problems • Duct leakage reduced from 35%to 20% • Duct insulation increased from R2 to R6 • Proper charge • Proper airflow • Proper sizing
Cost Benefit of QI • Savings based on 10 cents/kWh electricity price
Comparison of SEER versus QI *13 SEER Baseline efficiency used for 3 ton unit
Barriers to Market Correction • Even though there are large potential savings from improving installation practices the market has not corrected itself because: • Consumers are unaware that improper installation affects efficiency and comfort (view HVAC similar to an appliance) • Consumers do not know their performance is low (If cold air is blowing they don’t usually complain) • Installation technicians rely on “rules of thumb” • “Time is money” business model • Manufacturer’s are willing to absorb warranty claims for units that have failed because of installation issues • Definition of a quality installation is not defined
Program Scope • Residential installations • New and replacement systems • Central air conditioning and air-source heat pump • Rated capacity up to 65,000 BTU/H • Homes with multiple systems must verify each unit separately • ENERGY STAR qualified equipment encouraged
Utility Develop program standards, policies and procedures Manage program Recruit and train qualified contractors Program marketing Ensure installations meet program standards Contract and manage verifiers Issue ENERGY STAR certificates to homeowners Track and evaluate program success Report data to EPA Verifier Provide QA Provide feedback to contractors Contractor Fulfill program training requirements Fulfill program participation agreement as written by program administrator Provide marketing material to homeowner Perform installation to program standards Document and report installation information EPA Provide 3rd party voice Assist with training development Provide technical support Work with stakeholders to improve installation practices Stakeholder Roles in ES HVAC QI
Third Party Basis for Program Design • Implementation guide • Marketing material • Sample commissioning and verification reports • Certificate • Training for participating contractors
ENERGY STAR HVAC QI Guidelines • Minimum requirements for installations under the program must meet the ANSI/ACCA HVAC Quality Installation Specification • The QI Specification identifies consensus requirements associated with quality installations, acceptable procedures for measuring or verifying the attainment of those requirements, and acceptable forms of documentation to show compliance to the requirements.
Program Details – Sizing and Equipment Selection • Requirements: • Total capacity between 95% and 115% of calculated system load or next largest nominal piece of equipment • Provide evidence of matched system • Verification: • Check to make sure load calculations were performed • Check to make sure calculations are reasonable (dimensions and sketches, orientation, assumed duct leakage) • Check for an ARI matched coils set
Program Details – Refrigerant Charge • Requirements: • Provide evidence that the system was properly charged via superheat, subcooling or a method specifically stated by the OEM. • Verification: • Refrigerant charge should be verified using the superheat or subcooling method. • Check the commissioning report to ensure that system conditions were within requirements at time of test.
Program Details – Air Flow • Requirements: • Airflow across the coil is within the range recommended by the OEM product data (typically between 350 to 450 CFM per ton) • Verification: • Check the airflow across the coil using the pressure matching method, flow grid measurement method, or anemometer traverse.
Program Details – Duct Leakage • Requirement (existing construction): • The total duct leakage must be less than or equal to 20 percent airflow, or at least a 50‑percent improvement over existing conditions. Or per local code if they exceed the specification • Verification: • Duct sealing should be verified using • Duct pressurization test • Blower door subtraction method • Hybrid duct pressurization/blower door subtraction method
Program Details - Additional Elements Electrical Amperage, voltage check Wire sizing Grounding Self certified Controls Compatibility Sequencing Self certified
Percent of Load Installed 6 5 4 3 Count 2 1 0 95% 100% 105% 110% 115% 120% 125% 130% 135% 140% 145% 150% 155% 160% 165% 170% 175% 180% 185% 190% 200% Airflow per ton of Installed Capacity 500 450 Airflow (CFM) 400 350 300 250 0 5 10 15 20 25 30 35 Unit Number Pilot Results Sizing Results - Replacement units were typically 0.5 to 1.0 Tons smaller but still oversized per the guidelines Issues - Sizing is essentially self reporting (difficult to verify) - 1% Design temperatures Strategy - Focus on downsizing not right-sizing - Allow for micro climate design temperatures - Manual J training is an entry requirement Air Flow Results - 90% of verified sites passed the in- field verification Issues - Guidelines are not standard practice - Lack of proper equipment Strategy - Approved air flow technique training is an entry requirement - Verifier should use same method to ensure consistency
35 30 Submitted 25 Passed 20 15 10 5 0 Level 1 - Data Review Level 2-Field Verification 25% 20% 15% Post Seal Leakage 10% 5% 0% 1 3 5 7 9 11 13 15 17 19 21 23 25 27 29 Sites = >50% reduction Pilot Results Charge Results – 70% of verified sites passed in-field verification Issues - Timeliness of verification (leaks) - Gauge calibration Strategy - Educate participants on the importance of calibration and make it part of the entry training Duct Leakage Results – 100% of verified sites passed in-field verification Issues - Standard practice in TX and CA but not elsewhere - Duct may need major repair which is expensive Strategy - Possible exclusion of duct leakage in the NE if ducts are in conditioned space
Cost of HVAC QI • Baseline Installation • sized (rule of thumb), airflow not measured, refrigerant charge is estimated based on “beer can cold”, and ducts are not tested. • EPA Guidelines for Quality Installation • Based on $75 per hour for technician
Payback of HVAC QI (Miami) 10 9 8 7 6 Payback (years) 5 4 3 2 1 0 0% 2% 4% 6% 8% 10% 12% 14% 16% 18% 20% 22% 24% 26% 28% % Savings Low End ($200) Mid Range ($550) High End ($1200) Average Cost ($650) Cost Effectiveness of HVAC QI(ACO of SEER 13 - $782)
Verification Level 1 Verification: Data review of Manual J calculations and commissioning report. The data review will include confirming that all required installation elements were performed using an approved method and check for data inconsistencies Level 2 Verification: In-field verification of the installation that follows established protocols. ACCA has established a committee that is currently working on HVAC QI verification protocols
SamplingRates Program requirements: 1. All sites receive a Level 1 verification 2. Level 2 verification sampling protocols: Phase 1 - Level 2 verification protocols will be conducted on 3 of the first 5 installations submitted by a new contractor participant. Phase 2 – Level 2 verification protocols will be conducted on 20% of the next 25 installation submittals. Phase 3 – After successful completion of Phase 1 and 2 the partner may use Level 2 verification protocols at a rate of 5%.
Cost of verification • Verifications cost approximately $300 per system • Costs could decrease with the use of an automated remote verification systems (i.e. Checkme, Enalasys, Testo) • Paid by the program administrator • Contractors can not self verify