Download
1 / 48
480 likes | 543 Views
A History of Modern Weather Forecasting. The Beginning: Weather Sayings. "Red Sky at night, sailor's delight. Red sky in the morning, sailor take warning." "Mare's tails and mackerel scales make tall ships take in their sails." "Clear moon, frost soon.”

E N D
The Beginning: Weather Sayings • "Red Sky at night, sailor's delight. Red sky in the morning, sailor take warning." • "Mare's tails and mackerel scales make tall ships take in their sails." • "Clear moon, frost soon.” • "Halo around the sun or moon, rain or snow soon." • "Rainbow in the morning gives you fair warning." • "When the stars begin to huddle, the earth will soon become a puddle."
By the late 1700s, reasonable (sufficiently precise and repeatable) weather instruments became available
More and more people took observations….and some early networks were started
Early Networks • 1792 the Mannheim (or Palatine) network included 39 stations from France, Germany, Italy, Scandinavia, Poland and Russia. • In the United States a formal observation program was initiated in l816 under the auspices of the surgeon-general of the army; army surgeons were required to take three observations per day of pressure, temperature, state of sky and winds. • By 1853 nearly 100 army posts were providing such daily reports. • Other American networks were organized under the auspices of the Navy and the Smithsonian Institution.
The problem: no way to rapidly communicate weather observations • This changed around 1845 with the invention of the telegraph
“Ol Probs” • Cleveland Abbe (“Ol’ Probabilities”), who led the establishment of a weather forecasting division within the U.S. Army Signal Corps. • Produced the first known communication of weather a weather forecast (including the term “probability”). Professor Cleveland Abbe, who issued the first public “Weather Synopsis and Probabilities” on February 19, 1871
On May 7, 1869, Abbe proposed to the Cincinnati Chamber of Commerce "to inaugurate such a system, by publishing in the daily papers, a weather bulletin, which shall give the probable state of the weather and river for Cincinnati and vicinity one or two days in advance”. Cleveland Abbe released the first public weather forecast on September 1, 1869. Following the signing by President Ulysses S. Grant of an authorization to establish a system of weather observations and warnings of approaching storms, on February 19, 1871, Abbe issued the first “official” public Weather Synopsis and Probabilities based on observations taken at 7:35 a.m.
An early example of a report: "Synopsis for past twenty-four hours; the barometric pressure had diminished in the southern and Gulf states this morning; it has remained nearly stationary on the Lakes. A decided diminution has appeared unannounced in Missouri accompanied with a rapid rise in the thermometer which is felt as far east as Cincinnati; the barometer in Missouri is about four-tenths of an inch lower than on Erie and on the Gulf. Fresh north and west winds are prevailing in the north; southerly winds in the south. Probabilities [emphasis added]; it is probable that the low pressure in Missouri will make itself felt decidedly tomorrow with northerly winds and clouds on the Lakes, and brisk southerly winds on the Gulf."
Weather Prediction Technology of the Late 1800s • The essential approach…simple temporal extrapolation. • No fronts, but they understood that discontinuities existed. • Little understanding of the evolution of weather systems.
The Next Major Advance • The Norwegian Cyclone Model, around 1920
Norwegian Cyclone Model • Provided a coherent consistent picture of airflows, clouds, and precipitation of cyclones and fronts • Provided a model for frontal and cyclone evolution, aiding future prediction.
Beginning of Reliable Upper Air Observations • The first true radiosonde that sent precise encoded telemetry from weather sensors was invented in France by Robert Bureau. Bureau coined the name "radiosonde" and flew the first instrument on January 7, 1929.
1940s: Upper Air Charts Became Available • Gave a 3D picture of what was happening • Upper flow steered storms, and thus provided a tool for forecasting cyclone movement.
Upper Level Chart
Summary I • Prior to approximately 1955, forecasting was basically a subjective art, and not very skillful. • The technology of forecasting was basically subjective extrapolation of weather systems, in the latter years using upper level flow. • Local weather details—which really weren’t understood-- were added subjectively.
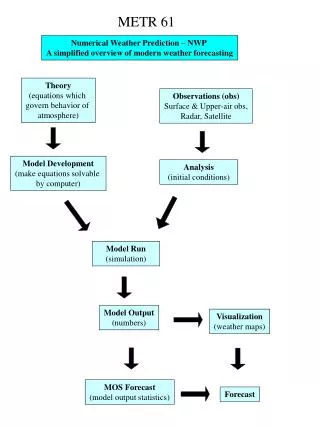
The Development of NWP • Vilhelm Bjerknes in his landmark paper of 1904 suggested that NWP was possible. • A closed set of equations existed that could predict the future atmosphere (primitive equations) • But NWP wasn’t practical then because there was no reasonable way to do the computations and sufficient data for initialization did not exist.
L. F. Richardson: An Insightful But Unsuccessful Attempt • In 1922 Richardson published a book Weather Prediction by Numerical Process that described an approach to solving the primitive equations: solving the equations on a grid using finite differences.
L. F. Richardson • He attempted to make a numerical forecast using a mechanical calculator • Unfortunately, the results were not good, probably because of problems with his initial conditions.
L. F. Richardson • He imagined a giant theater filled with human calculators… • So NWP had to wait until a way of doing the computations quickly was developed and more data…especially aloft… became available.
NWP Becomes Possible • By the mid to late 1940’s there was an extensive upper air network, plus many more surface observations. Thus, a reasonable 3-D description of the atmosphere was possible. • Also during this period digital programmable computers were becoming available…the first..the ENIAC
The Last Piece of the Puzzle • Meteorologists realized that useful numerical weather predictions were possible using a simplified equation set that waseasier to solve. • The Barotropic Vorticity Equation (conservation of absolute vorticity) was suggested as a first step
First NWP • The first successful numerical prediction of weather was made in April 1950, using the ENIAC computer at Maryland's Aberdeen Proving Ground • The prediction was for 500 mb height, covered North America, using a two-dimensional grid with 270 points about 700 km apart. • The results showed that even primitive NWP was superior to human subjective prediction. The NWP era had begun.
Evolving NWS • Early 50s: one-level barotropic model • Late 50s: Two-level baroclinic QG model (just like Holton!) • 1960s: Primitive equation models of increasing resolution and number of levels. • Resolution increases (distance between grid points decrease): 1958: 380 km, 1985: 80 km, 1995: 40 km, 2000: 22 km, 2002: 12 km
NWP Improvements in the Later 20th Century • Better resolution • Rapidly increasing data for initialization from weather satellites, radars, more surface observations, and other sources. • Better models: better numerics and physics
Forecast Skill Improvement National Weather Service Forecast Error Better Year
The Advent Of Statistical Post-Processing • In the 1960s and 1970s, the NWS developed and began using statistical post-processing of model output…known to most as Model Output Statistics…MOS. • The idea: models have systematic biases …why not remove them based on past performance? • Also, might be able to statistically add the effects of local features not resolved by the model.
MOS • Based on linear regression: Y=a0 + a1X1 + a2X2+ a3X3 + … • MOS is available for many parameters and time and greatly improves the quality of most model predictions.
1990-2003+The computers models become capable of simulating/forecasting local weather. As the grid spacing decreased to 15 km and below… it became apparent that many of the local weather features could often be simulated and forecast by the models.
2007-2008 12-km UW MM5 Real-time 12-km WRF-ARW and WRF-NMM are similar December 3, 2007 0000 UTC Initial 12-h forecast 3-hr precip.
2007-2008 4-km MM5 Real-time