Download
1 / 30
310 likes | 410 Views
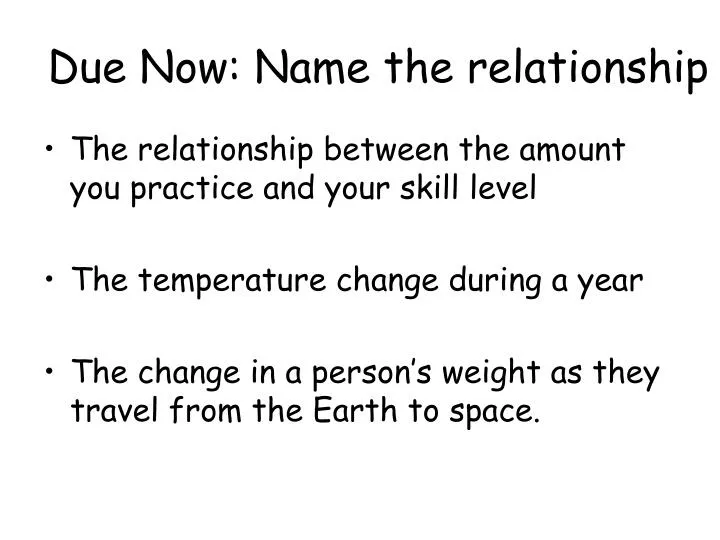
Due Now: Name the relationship. The relationship between the amount you practice and your skill level The temperature change during a year The change in a person’s weight as they travel from the Earth to space. Seasons. Topic: Graphing the Changing Environment. Time. Day /Night. Graphs.

E N D
Due Now: Name the relationship • The relationship between the amount you practice and your skill level • The temperature change during a year • The change in a person’s weight as they travel from the Earth to space.
Seasons Topic: Graphing the Changing Environment Time Day/Night
Parts of a Graph • -
Y Axis – Dependent Variable - Origin X Axis – Independent Variable -
Relationship between hours worked and pay Independent Variable – Working Hours Dependent Variable – Pay Setting up a graph
Graphing – Hours worked & Paycheck When hours worked is high, pay is high 28 21 Pay (dollars) Direct Relationship 14 7 When hours worked is low pay is low 1 2 3 4 Time Worked (hours)
Inverse or Indirect Relationship - - Y Axis Density Temperature X Axis
Cyclic (Cycle) Relationship - High Tides Low Time (hours)
Constant – No change-Static - Mass Travel from the Earth to the Moon
Non-Sense Graph DO NOT PICK – NOT POSSIBLE
Rate of Change - Rate of Change = Change in Field Value Change in Time
Graphing – Hours worked & Paycheck What is the rate of change between these two points? 28 21 Pay (dollars) 14 7 1 2 3 4 Time Worked (hours)
Example (28 – 7) Dollars (4-1) Hours 21 Dollars 3 Hours 7 Dollars/Hours
Example D Number of Cell Phone Users What is the rate of change from point A to point B C B A Years (1986 = 1)
Example (A-B) (3000–1000) Users (4-2) Years 2000 Users 2 Years 1000 Users/Year
Example D Number of Cell Phone Users What is the rate of change from point B to point C C B A Years (1986 = 1)
Example (B-C) (14,000–3,000) Users (7-4) Years 11,000 Users 3 Years 3,667 Users/Year
Example (C-D) • What is the rate of change between Points C and D?
Extrapolation - Y Axis Density Temperature X Axis
Interpolation - Y Axis Density Temperature X Axis
Equilibrium • - • - Dynamic
Example – Oceans are constantly evaporating, why is the ocean level remaining constant?
Name that Relationship Y Axis - X Axis
Name that Relationship Y Axis - X Axis
Name the relationship • The relationship between the amount you practice and your skill level • The temperature change during a year • The change in a person’s weight as they travel from the Earth to space. - - -
FQ Draw a graph showing the relationship between time studying and grade on a test