Download
1 / 27
280 likes | 408 Views
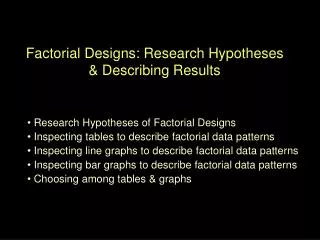
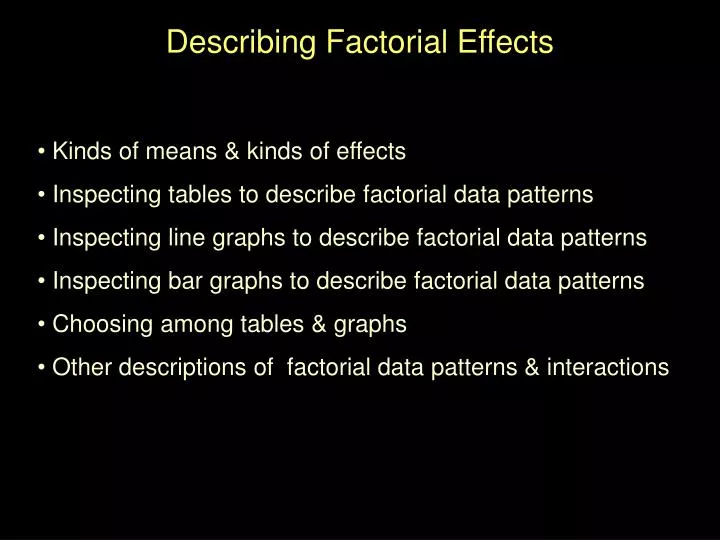
Describing Factorial Effects. Kinds of means & kinds of effects Inspecting tables to describe factorial data patterns Inspecting line graphs to describe factorial data patterns Inspecting bar graphs to describe factorial data patterns Choosing among tables & graphs

E N D
Describing Factorial Effects • Kinds of means & kinds of effects • Inspecting tables to describe factorial data patterns • Inspecting line graphs to describe factorial data patterns • Inspecting bar graphs to describe factorial data patterns • Choosing among tables & graphs • Other descriptions of factorial data patterns & interactions
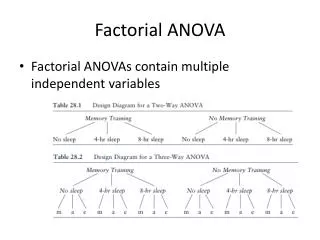
Interpreting Factorial Results based on “Inspection” Now that we have the basic language we will practice examining and describing main effects and interactions based on tables, line graphs and bar graphs portraying factorial results. Once you know how to describe the results based on “inspection” it will be a very simple task to learn how to apply NHST to the process. As in other designs we have looked at “an effect” as a numerical difference between two “things”, in factorial analyses… Main effects involve differences between marginal means. Simple effects involve differences between cell means. Interactions involve the differences between simple effects.
Inspecting a Table to determine simple effects & interaction… Task Presentation Paper Computer Task Difficulty Easy 90 90 Hard 50 70 We’ll look at describing the interaction using each set of simple effects in turn. Then we’ll look at describing each main effect (and checking if each is descriptive or misleading)
Inspecting a Table to determine simple effects & interaction… Simple Effects of Task Presentation Task Presentation Task Paper Computer Difficulty Easy 90 90 Hard 50 70 SE of Task Pres for EasyTasks 90 vs. 90 SE = 0 SE of Task Pres for HardTasks 50 vs. 70 SE = 20 There is an interaction of Task Difficulty and Task Presentation as they relate to performance.There is no effect of presentation for easy tasks, however for hard tasks computer presentations led to higher scores than did paper presentations.
Inspecting a Table to determine simple effects & interaction… Simple Effects of Task Difficulty Task Presentation Task Paper Computer Difficulty Easy 90 90 Hard 50 70 SE of Task Diff for Paper Pres. 90 vs. 50 SE = 40 SE of Task Diff for Computer Pres. 90 vs. 70 SE = 20 There is an interaction of Task Difficulty and Task Presentation as they relate to performance. Easy tasks are consistently performed better than hard tasks, however this effect is larger for paper presentations than for computer presentations.
Inspecting a Table to determine main effects … marginal means for Task Difficulty Task Presentation 90 vs. 60 Easy > Hard Task Paper Computer Difficulty Easy 90 90 90 Hard 50 70 60 This main effect is descriptive.. Easy > Hard for BOTH Paper & Computer tasks Overall, easy tasks were performed better than hard tasks.
Inspecting a Table to determine main effects … marginal means for Task Presentation Task Presentation 70 vs. 80 Paper < Computer Task Paper Computer Difficulty Easy 90 90 Hard 50 70 70 80 This main effect is potentially misleading ... Paper < Computer only for hard tasks Paper = Computer for easy tasks Overall, there was better performance on computer than paper tasks. However, this was not descriptive for easy tasks.
Inspecting a line graph … “Different differences” and “Differential Simple Effects” both translate into NONPARALLEL LINES in a figure. Performance Key for Task DifficultyO= Easy X= Hard 90 OO 70 X 50 X 30 Paper Computer Task PresentationP C Easy 90 90 Hard 50 70
Inspecting a line graph to determine simple effects & interaction… Performance 90 OO Simple Effects of Task Presentation 70 X 50 X 30 Paper Computer Task Presentation Key for Task Difficulty O= Easy X= Hard SE of Task Pres for EasyTasks 90 vs. 90 SE = 0 SE of Task Pres for HardTasks 50 vs. 70 SE = 20 There is an interaction of Task Difficulty and Task Presentation as they relate to performance.There is no effect of presentation for easy tasks, however for hard tasks computer presentations led to higher scores than did paper presentations.
Inspecting a line graph to determine simple effects & interaction… Performance 90 OO 70 X 50 X 30 Paper Computer Task Presentation Key for Task Difficulty O= Easy X= Hard Simple Effects of Task Difficulty SE Task Diff for Paper Pres. 90 vs. 50 SE = 40 SE Task Diff for Computer Pres. 90 vs. 70 SE = 20 There is an interaction of Task Difficulty and Task Presentation as they relate to performance. Easy tasks are consistently performed better than hard tasks, however this effect is larger for paper presentations than for computer presentations.
How notto Inspect a line drawing to determine if there is an interaction… This is a “cross-over” interaction -- it certainly IS an interaction Performance but it IS NOT the only kind !! 90 70 50 30 Paper Computer Task Presentation Key for Task Difficulty Easy Hard
Inspecting a line graph to determine if there are main effects… marginal means for Task Difficulty Performance 90 vs. 60 Easy > Hard 90 OO 70 X 50 X 30 Paper Computer Task Presentation Key for Task Difficulty O= Easy X= Hard This main effect is descriptive.. Easy > Hard for BOTH Paper & Computer tasks Overall, easy tasks were performed better than hard tasks.
Inspecting a line graph to determine if there are main effects… Performance marginal means for Task Pres 70 vs. 80 Paper < Computer 90 OO 70 X 50 X 30 Paper Computer Task Presentation Key for Task Difficulty O= Easy X= Hard This main effect is potentially misleading ... Paper < Computer for hard tasks but... Paper = Computer for easy tasks Overall, there was better performance on computer than paper tasks. However, this was not descriptive for easy tasks.
Inspecting a Bar Graph … “Different differences” and “Differential Simple Effects” both translate into “different height differences” in a bar graph. Performance 90 70 50 30 Easy Hard Easy Hard Paper Computer P C Task Presentation Easy 90 90 Hard 50 70
Inspecting a Bar Graph to determine simple effects & interaction… “Different differences” and “Differential Simple Effects” both translate into “different height differences” in a bar graph. Performance Simple Effects of Task Difficulty 90 70 50 30 Easy Hard Easy Hard Paper Computer Task Presentation SE Task Diff for Paper Pres. 90 vs. 50 SE = 40 SE Task Diff for Computer Pres. 90 vs. 70 SE = 20 There is an interaction of Task Difficulty and Task Presentation as they relate to performance. Easy tasks are consistently performed better than hard tasks, however this effect is larger for paper presentations than for computer presentations.
Inspecting a Bar Graph to determine simple effects & interaction… “Different differences” and “Differential Simple Effects” both translate into “different height differences” in a bar graph. Performance Simple Effects of Task Presentation 90 70 50 30 Easy Hard Easy Hard Paper Computer Task Presentation SE of Task Pres for EasyTasks 90 vs. 90 SE = 0 SE of Task Pres for Hard Tasks 50 vs. 70 SE = 20 There is an interaction of Task Difficulty and Task Presentation as they relate to performance.There is no effect of presentation for easy tasks, however for hard tasks computer presentations led to higher scores than did paper presentations.
Inspecting a Bar graph to determine if there are main effects… “Different differences” and “Differential Simple Effects” both translate into “different height differences” in a bar graph. Performance marginal means for Task Presentation70 vs. 80 Paper < Computer 90 70 50 30 Easy Hard Easy Hard Paper Computer Task Presentation This main effect is potentially misleading ... Paper < Computer for only for hard tasks Paper = Computer for easy tasks Overall, there was better performance on computer than paper tasks. However, this was not descriptive for easy tasks.
Inspecting a Bar graph to determine if there are main effects… “Different differences” and “Differential Simple Effects” both translate into “different height differences” in a bar graph. marginal means for Task Difficulty Performance 90 vs. 60 Easy > Hard 90 70 50 30 Easy Hard Easy Hard Paper Computer Task Presentation This main effect is descriptive.. Easy > Hard for BOTH Paper & Computer tasks Overall, easy tasks were performed better than hard tasks.
Choosing Among Tables, Line Graphs and Bar Graphs Tables • Provides more detail (exact means and standard deviations) • Easier to see main effects (can include marginal means) • Harder to see the interaction Line Graphs • Easier to see interaction pattern (than tables) • Harder to see main effects (than tables) • “Formally” limited to using when quantitative IV on X axis Bar Graphs • Interactions -- easier than tables, not as easy as line graphs • Mains -- harder to see than tables Note: Any of these can include std, or SEM “whiskers”
Sometimes our hypotheses aren’t about patterns of simple effects, but … are about other kinds of mean difference patterns… Training Modality Visual Touch VV TV Testing Modality Touch Visual TT VT The IVs are “Training Modality” and “Testing Modality” leading to this 2x2 factorial design… Among these conditions, 2 are “intramodal” (VV & TT) & 2 are “cross-modal” (VT & TV). RH:s for the study were… RH1: VV > TT hypothesized dif among intramodal conditions RH2: VT > TV hypothesized dif among cross-modal conditions Neither of which corresponds to a “simple effect” !
In this case there is an “organizational” solution… Just re-label the IVs… “Training Modality” Vision vs. Touch & “Testing Modality” Intramodal vs. Cross-modal then… Training Modality Visual Touch VV TT Testing Modality Cross Intra TV VT RH1: VV > TT SE of Training Modality for Intramodal tests RH2: VT > TV SE of Training Modality for Cross-modal tests
Another Example – same research area… This was the common design for studying intra- and cross-modal memory with the usual RH: VV > VT > TV = TT … which can be directly & completely tested using the 6 pairwise comparisons among the 4 conditions. Performance VV VT TV TT Training Modality Visual Touch After several studies, someone noticed that these conditions define a factorial… 99.6% 24.8 % Testing Modality Touch Visual 26.2 % 25.6 %
There was an interaction! There was a (misleading) main effect of Training Modality. There was a (misleading) main effect of Testing Modality. Training Modality Visual Touch 99.6% 24.8 % Testing Modality Touch Visual 26.2 % 25.6 % Notice how the very large VV cell mean “drives” both main effects (while ensuring they will each be misleading) as well as driving the interaction!?! However interesting and informative was the idea from the significant interaction, that “performance is the joint effect of Training and Testing Modalities” – none of these “simple effect tests” give a direct test of the RH: The set of 6 pairwise comparisons gives the most direct RH test!!!
“Describing a pattern of data that includes an interaction” vs. “Describing the Interaction in a pattern of data” The pattern of data shown the figure demonstrate that while Task Presentation has no effect for Easy tasks, for Hard tasks, those using Computer did better than when using Paper. This is “a description of a pattern of data that includes an interaction” 70 50 30 Paper Computer Task Presentation Easy Hard Technically, it would be wrong to say that “The interaction shownin the figure demonstrates that while Task Presentation has no effect for Easy tasks, for Hard tasks, those using Computer did better than when using Paper. In order to “describe the interaction effect” we have to isolate the “interaction effect” from the main effects…
The process, called “mean polishing,” involves residulaizing the data for the main effects, leaving the interaction effect… Presentation Paper Comp means row effect Easy 90 90 90 +15 Hard 50 70 60 -15 means 70 8075 grand mean col effect -5 +5 Correcting for row effects (subtract +/- 15) Presentation Paper Comp Easy 75 75 Hard 65 85 Correcting for column effects (subtract +/- 5) Presentation Paper Comp Easy 80 70 Hard 70 80
Correcting for Grand Mean (subtract 75) Presentation Paper Comp Easy 5 -5 Hard -5 5 10 5 0 -5 -10 Paper Computer Task Presentation Hard Hard Hard Easy Easy The proper description of “the interaction effect” is The interaction shownin the figure demonstrates that for Easy tasks those using Paper performed better than those using Computer, however, for Hard tasks, those using Computer performed better than those using Paper.
Looked at in this way, interactions differ in only 2 ways… Which group has “increase” and which had “decrease” Hard Easy vs. Easy Hard The “strength” of the interaction effect… Hard Hard Hard Hard Hard Hard Hard Hard Hard Easy Easy Easy Easy Easy Easy Easy Easy Easy Easy null small mediumlarge