Download
1 / 11
120 likes | 337 Views
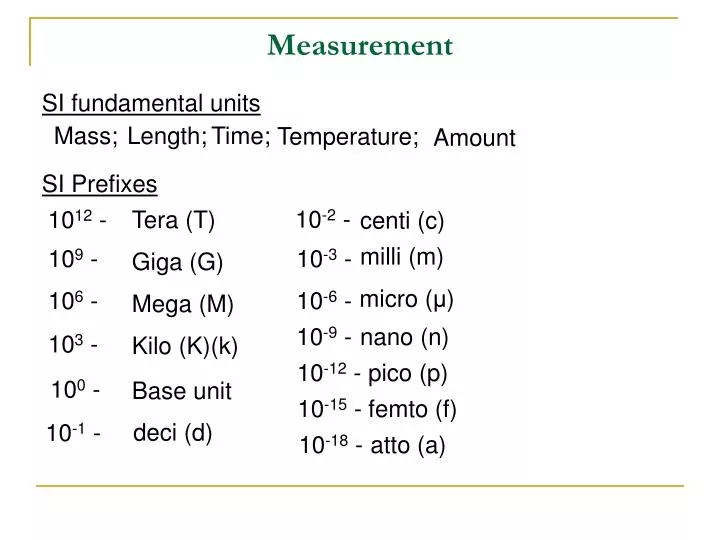
Measurement. SI fundamental units. Mass;. Length;. Time;. Temperature;. Amount. SI Prefixes. 10 -2 -. 10 12 -. Tera (T). centi (c). milli (m). 10 9 -. 10 -3 -. Giga (G). micro ( μ ). 10 6 -. 10 -6 -. Mega (M). 10 -9 -. nano (n). 10 3 -. Kilo (K)(k). 10 -12 -.

E N D
Measurement SI fundamental units Mass; Length; Time; Temperature; Amount SI Prefixes 10-2 - 1012 - Tera (T) centi (c) milli (m) 109 - 10-3 - Giga (G) micro (μ) 106 - 10-6 - Mega (M) 10-9 - nano (n) 103 - Kilo (K)(k) 10-12 - pico (p) 100 - Base unit 10-15 - femto (f) deci (d) 10-1 - 10-18 - atto (a)
Measurement • n.b. - Precision may also refer to how fine a particular instrument will measure. The finer an instrument, the more likely a group of measurements will be closer together. eg. graduated cylinder vs. beaker. • Accuracy – How close a measurement is to the actual value • Precision – How close together a group of measurements is • Uncertainty - Each instrument has a limit to its precision. Measurements are typically reported to 1/10th of the smallest division for instruments with markings. The last digit is estimated and the uncertainty of the measurement is given as + 0.5 x the reported precision. For electronics the uncertainty is + the last displayed digit. Molar mass?
Measurement • Because each measurement has uncertainty there is a limit to the precision with which we can determine an answer. This precision is determined using sig figs. • What is significant? • All nonzero integers • Trailing zeros followed by a decimal ex: 200. = 3 sf • Zero to the right of a decimal, with a number in front ex: 0.100 = 3 • What is not? • Leading zeros and zeros to the right of a decimal with no nonzero number in front ex: 0.00300 = ? Sf • Trailing zeros not followed by a decimal ex: 200 = 1 sf • For multiplication and division, use least # of digits • For addition and subtraction, answer should match # with least precision
Propagation of Error • Uncertainty is propagated when measurements are used to calculate a value • When you do lab calculations for DCP this uncertainty should always be reported as part of your calculated value. In other lab work it is optional. • Also according to IB; they seem to want you to round your final answer based on your uncertainty? • Example: • If uncertainty 2% then round your results to 1 SF • If uncertainty > 2% then round to 2 SF We will show this as separate step with notation! • For addition/subtraction just add the uncertainties • For multiplication and division convert the uncertainties to percent, add them together to get the total uncertainty in percent and then convert back to the uncertainty in terms of the measurement. • Multiply percent uncertainties when raising to an exponent
Propagation of Error • Example: Volume of solution measured with grad. cyl. Say 17.4 + .05 mL from one cylinder is added to 55.7 + .05 mL from another = 73.1 + .10 mL • Example: Determining density by volume displacement Mass on balance – 6.56 + .01 g (.01/6.56) x 100 = .2% Volume in cylinder 20.2 + .05 mL Volume + object = 31.7 + .05 mL Volume of object = 11.5 + .10 mL (.10/11.5) x 100 = .87% Density = 6.56 ÷ 11.5 = 0.570 g/mL.87 + .2 = 1.1% (1.07%) .570 x .0107 = .0061 (rounded to 2 sf because of mass uncertainty. Density = .570 + .0061 g/mL
Error Analysis • There are two main types of errors that can effect values • Random error – when an experimenter estimates a reading there is an equal probability of being too high or low • Causes: • Readability of measuring instrument • Change in conditions (pressure, temp, etc.) • Incorrect/misinterpretation of the reading • Insufficient data (ex: not enough trials) • Systematic error – Occurs in the same direction each time, results from poor experimental design/technique or from poorly calibrated/defective instrument (cannot be improved w/ more trials) • Examples: • Measuring volume at top of meniscus (too high) • Overshooting volume delivered in titration (too high) • Heat lost from calorimeter (smaller ΔT) • Balance measures mass too low
Two common ways to present error • Compared to expected value (% error) = Exp – Theo x 100 Theo • Precision (deviation) – comparing a set of measurements A good strategy for IB data analysis is to compare deviation with uncertainty to see if the deviation is within the uncertainty range of the measurements used to determine values, or if some other error (eg. experimenter) is involved.
Types of Deviation • Average Deviation • 4 general chemistry students measure the mass of a text book 1 – 2.38 kg 2 – 2.23 kg 3 – 2.07 kg 4 – 2.55 kg • Determine the mean • Determine the absolute difference between each value and the mean • Add the differences together • Divide by the total number of measurements • Express answer as: mean + average deviation • Percent average deviation • Divide the average deviation by the mean; x 100 Express answer as: mean + % deviation Percent (average) deviation is expressed to only 1sig fig
Types of Deviation • Standard deviation • Steps a and b are the same • Square each difference • Use the following formula to calculate the standard deviation: √∑(x – x)2 (n – 1) n.b. – The value for the mean is based on precision NOT sig figs and the precision for the mean and the deviation should match(except for % deviation). _ Be sure to express the standard deviation as a function of the mean.
Types of Deviation • Practice Example: • Seven groups of students each experimentally determined the thickness of the Zn layer on a piece of galvanized iron. The following values were reported (in cm.): • .00193; .00220; .00189; .00216; .00278; .00226; .00208 • Express the mean value for the thickness of Zn including • Average deviation • % deviation • Standard deviation
Dimensional Analysis • A method used primarily for unit conversion. • Works by multiplying with conversion factors • Example: A pancake – eating contest was won by an individual who ate 74 pancakes in 6.0 minutes. At that pace, how many eggs would he have eaten in 1.00 hour? Assume 1 egg was used to make 8 pancakes. • Light travels at 186,000 mi/s. How many centimeters would light travel in one year? Assume 365.24 da/yr and 1 mi = 1.609 km.