Download
1 / 14
150 likes | 302 Views
Efficacy and safety of cholesterol-lowering treatment: prospective meta-analysis of data from 90,056 participants in 14 randomised trials of statins. Lancet 2005 366 : 1267-1134 doi:10.1016/S0140-6736(08)60104-X . Effects on CAUSE-SPECIFIC MORTALITY per mmol/L LDL cholesterol reduction.

E N D
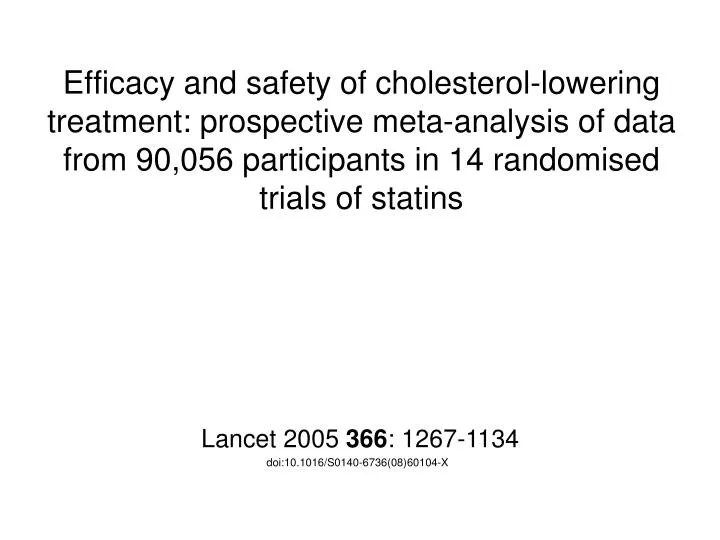
Efficacy and safety of cholesterol-lowering treatment: prospective meta-analysis of data from 90,056 participants in 14 randomised trials of statins Lancet 2005 366: 1267-1134 doi:10.1016/S0140-6736(08)60104-X
Effects on CAUSE-SPECIFIC MORTALITY per mmol/L LDL cholesterol reduction RR (95% CI) RR (99% CI) Events (%) Cause of death Rate Ratio (CI) Treatment Control Vascular causes 0·81 (0·76 – 0·85) CHD 1548 (3·4) 1960 (4·4) Stroke 265 (0·6) 291 (0·6) 0·91 (0·74 – 1·11) Other vascular 289 (0·6) 302 (0·7) 0·95 (0·78 – 1·16) 0·93 (0·83 – 1·03) Any non-CHD vascular 554 (1·2) 593 (1·3) 2102 (4·7) 2553 (5·7) 0·83 (0·79 – 0·87) Any vascular Non-vascular causes 1·01 (0·91 – 1·12) Cancer 1094 (2·4) 1069 (2·4) Respiratory 0·82 (0·62 – 1·08) 98 (0·2) 125 (0·3) Trauma 0·89 (0·59 – 1·34) 51 (0·1) 57 (0·1) Other/unknown 487 (1·1) 550 (1·2) 0·87 (0·73 – 1·03) Any non-vascular 1730 (3·8) 1801 (4·0) 0·95 (0·90 – 1·01) ANY DEATH 3832 (8·5) 4354 (9·7) 0·88 (0·84 – 0·91) 1·0 1·5 0·5
Relation between the proportional reduction in MAJOR VASCULAR EVENTS and mean absolute LDL reduction in 14 statin trials
RR (95% CI) RR (99% CI) Events (%) Endpoint Treatment Control Rate Ratio (CI) Non-fatal MI 2001 (4·4) 2769 (6·2) 0·74 (0·70 – 0·79) CHD death 1548 (3·4) 1960 (4·4) 0·81 (0·75 – 0·87) Effects on MAJOR VASCULAR EVENTS per mmol/L LDL cholesterol reduction Any major coronary event 3337 (7·4) 4420 (9·8) 0·77 (0·74 – 0·80) 0·75 (0·69 – 0·82) CABG 713 (3·3) 1006 (4·7) PTCA 510 (2·4) 658 (3·1) 0·79 (0·69 – 0·90) Unspecified 1397 (3·1) 1770 (3·9) 0·76 (0·69 – 0·84) Any coronary revascularisation 2620 (5·8) 3434 (7·6) 0·76 (0·73 – 0·80) Haemorrhagic stroke 105 (0·2) 99 (0·2) 1·05 (0·78 – 1·41) Presumed ischaemic stroke 1235 (2·8) 1518 (3·4) 0·81 (0·74 – 0·89) Any stroke 1340 (3·0) 1617 (3·7) 0·83 (0·78 – 0·88) Any major vascular event 6354 (14·1) 7994 (17·8) 0·79 (0·77 – 0·81) 0·5 1·0 1·5
Effects on MAJOR VASCULAR EVENTS per mmol/L LDL cholesterol reduction, subdivided by baseline prognostic factors (1) RR (95% CI) RR (99% CI) Events (%) Treatment Rate Ratio (CI) Groups Control Prior disease Prior disease Post MI 3051 (21·2) 3860 (26·9) 0·79 (0·75 – 0·83) Other CHD 1257 (19·3) 1581 (24·2) 0·80 (0·73 – 0·87) None None 2046 (8·5) 2553 (10·6) 0·78 (0·72 – 0·84) Age (years) 65 3454 (12·5) 4448 (16·2) 0·78 (0·74 – 0·82) ≤ >65 2900 (16·6) 3546 (20·3) 0·81 (0·77 – 0·86) Gender Male Male 5097 (14·9) 6504 (19·0) 0·78 (0·75 – 0·81) 0·83 (0·76 – 0·91) Female Female 1257 (11·7) 1490 (13·8) Treated hypertension Yes Yes 3925 (15·8) 4783 (19·2) 0·81 (0·77 – 0·85) No 0·77 (0·73 – 0·82) 2429 (12·0) 3211 (15·9) History of diabetes 0·79 (0·72 – 0·86) Yes 1465 (15·6) 1782 (19·2) No No 4889 (13·7) 6212 (17·4) 0·79 (0·76 – 0·82) Diastolic blood pressure (mm Hg) 90 90 ≤ 5191 (14·9) 6493 (18·6) 0·79 (0·76 – 0·83) >90 0·77 (0·80 – 0·84) 1154 (11·4) 1496 (14·8) Overall 7994 (17·8) 0·79 (0·77 – 0·81) 6354 (14·1) p<0.00001 0 · 5 1 · 0 1 · 5
RR (95% CI) RR (99% CI) Effects on MAJOR VASCULAR EVENTS per mmol/L LDL cholesterol reduction, subdivided by baseline prognostic factors (2) Events (%) Treatment Control Groups Rate Ratio (CI) Total cholesterol (mmol/L) ≤ 5.2 1465 (13·5) 1808 (16·6) 0·76 (0·69 – 0·85) 5.2-6.5 3312 (13·9) 4159 (17·4) 0·79 (0·75 – 0·83) >6.5 1547 (15·2) 1992 (19·7) 0·80 (0·76 – 0·86) LDL cholesterol (mmol/L) ≤ 3.5 2237 (13·4) 2776 (16·7) 0·76 (0·71 – 0·82) 3.5-4.5 2680 (14·2) 3344 (17·6) 0·79 (0·75 – 0·84) 0·81 (0·76 – 0·87) >4.5 1364 (15·8) 1773 (20·4) HDL cholesterol (mmol/L) 0.9 2277 (18·2) 2876 (22·7) ≤ 0·78 (0·73 – 0·83) 0.9-1.1 1813 (14·3) 2278 (18·2) 0·79 (0·74 – 0·84) >1.1 2223 (11·4) 2789 (14·2) 0·79 (0·75 – 0·85) Triglycerides (mmol/L) 0·79 (0·74 – 0·85) 1.4 2125 (13·4) 2665 (16·8) ≤ 0·78 (0·73 – 0·83) 1.4-2.0 1821 (13·8) 2389 (18·0) >2.0 2357 (15·3) 2868 (18·8) 0·80 (0·74 –0·85) Overall 6354 (14·1) 7994 (17·8) 0·79 (0·77 – 0·81) p<0.00001 0·5 1·0 1·5
Events (%) Endpoint Rate Ratio (CI) Treatment Control Effects on MAJOR VASCULAR EVENTS per mmol/L LDL cholesterol reduction, by year 1747 (3·9) 1951 (4·3) 0·90 (0.85 – 0·96) YEAR 0-1 YEAR 1-2 1231 (2·9) 1603 (3·8) 0·78 (0·73 – 0·83) YEAR 2-3 1151 (2·8) 1543 (3·9) 0·74 (0·69 – 0·79) 946 (2·6) 1306 (3·8) 0·72 (0·67 – 0·78) YEAR 3-4 YEAR 4-5 811 (2·9) 993 (3·7) 0·79 (0·74 – 0·86) 598 (3·8) 468 (2·8) 0·74 (0·67 – 0·82) YEAR 5+ RR (95% CI) p<0.00001 1·0 1·5 0·5
RR (95% CI) RR (99% CI) Site of Events (%) Rate Ratio (CI) first cancer Treatment Control Effects on CANCER incidence per mmol/L LDL cholesterol by site 1·03 (0·90 - 1·17) Gastrointestinal 543 (1·4) 512 (1·3) Genitourinary 760 (1·9) 775 (1·9) 0·97 (0·87 - 1·09) 0·97 (0·83 - 1·14) Respiratory 372 (0·9) 390 (1·0) 1·09 (0·79 - 1·49) Breast (women) 105 (1·1) 92 (0·9) 0·94 (0·67 - 1·32) Haematological 97 (0·3) 106 (0·4) Melanoma 77 (0·2) 80 (0·2) 1·03 (0·71 - 1·50) Other/unknown 613 (1·5) 581 (1·5) 1·08 (0·90 - 1·29) Any site 2567 (6·4) 2536 (6·4) 1·00 (0·95 - 1·06) p = 0.9 0·5 1·0 1·5
RR (95% CI) RR (99% CI) Effects on CANCER incidence per mmol/L LDL cholesterol by year Events (%) Treatment Control Rate Ratio (CI) 0-1 year 412 (1·0) 441 (1·1) 0·95 (0·81 – 1·12) 1-2 years 532 (1·4) 513 (1·3) 1·03 (0·89 – 1·20) 2-3 years 512 (1·4) 514 (1·4) 0·99 (0·85 – 1·15) 3-4 years 494 (1·4) 476 (1·4) 1·00 (0·86 – 1·16) 1·02 (0·86 – 1·21) 4-5 years 384 (1·3) 374 (1·3) 1·05 (0·84 – 1·32) 5+ years 233 (1·3) 218 (1·2) All times 2567 (6·4) 2536 (6·4) 1·00 (0·95 –1·06) p = 0.9 0·5 1·0 1·5
48 (39 -57) 27 (20 -34) 8 (4 -12) 5 year absolute benefits on particular vascular outcomes per mmol/l LDL cholesterol reduction in participants WITH previous MI or CHD 30 30 25 25 Event Rate (%) 20 15 15 10 10 5 5 0 0 Major vascular events Major coronary events Stroke Coronary revascularisation Outcomes avoided 30 (24-37) per 1000 (95% CI)
5 year absolute benefits on particular vascular outcomes per mmol/l LDL cholesterol reduction in participants WITHOUT previous MI or CHD 30 30 25 25 Event Rate (%) 20 15 15 10 10 5 5 0 0 Major coronary events Stroke Major vascular events Coronary revascularisation Outcomes avoided 5 (1-8) 25 (19-31) 18 (14-23) 12 (9-16) per 1000 (95% CI)
RR (95% CI) RR (99% CI) Effects on MAJOR CORONARY EVENTS per mmol/L LDL cholesterol reduction, subdivided by baseline prognostic factors (1) Rate Ratio (CI) Groups Treatment Control Prior disease 1681 (11·7) 2207 (15·4) Post-MI 0·78 (0·74 – 0·84) 568 (8·7) Other CHD 744 (11·4) 0·77 (0·68 – 0·87) 1088 (4·5) 0·72 (0·66 – 0·80) None 1469 (6·1) Age (years) ≤ 65 1671 (6·1) 2344 (8·5) 0·74 (0·69 – 0·79) 0·81 (0·76 – 0·88) 1666 (9·5) 2076 (11·9) >65 Gender Male 2686 (7·8) 3630 (10·6) 0·76 (0·72 – 0·80) 651 (6·1) 790 (7·3) 0·82 (0·73 – 0·93) Female Treated hypertension 0·79 (0·74 – 0·84) Yes 2038 (8·2) 2596 (10·4) 1299 (6·4) 1824 (9·1) No 0·75 (0·70 – 0·81) History of diabetes 776 (8·3) 979 (10·5) 0·78 (0·69 –0·87) Yes No 2561 (7·2) 3441 (9·6) 0·77 (0·73 – 0·81) Diastolic blood pressure (mmHg) ≤ 90 2711 (7·8) 3590 (10·3) 0·77 (0·73 – 0·81) 618 (6·1) 827 (8·2) 0·76 (0·68 – 0·85) >90 Overall 0·77 (0·74 – 0·80) 3337 (7·4) 4420 (7·4) p<0.0001 0·5 1·0 1·5
RR (95% CI) RR (99% CI) Effects on MAJOR CORONARY EVENTS per mmol/L LDL cholesterol reduction, subdivided by baseline prognostic factors (2) Groups Treatment Control Rate Ratio (CI) Total cholesterol (mmol/L) ≤ 748 (6·9) 940 (8·6) 5.2 0·76 (0·66 – 0·88) 5.2-6.5 1678 (7·0) 2246 (9·4) 0·76 (0·71 – 0·82) >6.5 896 (8·8) 1220 (12·1) 0·78 (0·72 – 0·84) LDL cholesterol (mmol/L) ≤ 0·76 (0·68 – 0·84) 1130 (6·8) 1443 (8·7) 3.5 1374 (7·3) 1814 (9·6) 0·77 (0·71 – 0·83) 3.5-4.5 801 (9·3) 1120 (12·9) >4.5 0·78 (0·72 – 0·85) HDL cholesterol (mmol/L) ≤ 0.9 1167 (9·3) 1538 (12·1) 0·76 (0·70 – 0·84) 0.9-1.1 939 (7·4) 1270 (10·2) 0·76 (0·70 – 0·83) 1207 (6·2) 1595 (8·1) >1.1 0·77 (0·71 – 0·84) Triglycerides (mmol/L) ≤ 1162 (7·3) 1521 (9·6) 1.4 0·78 (0·71 – 0·85) 1304 (9·8) 0·77 (0·71 – 0·84) 937 (7·1) 1.4-2.0 >2.0 1217 (7·9) 1564 (10·2) 0·76 (0·69 – 0·83) 3337 (7·4) 4420 (9·8) Overall 0·77 (0·74 – 0·80) p<0.0001 0·5 1·0 1·5