Download
1 / 62
620 likes | 905 Views
Screening Needs for Roadway Lighting. Prepared for Presentation to the Project Steering Committee March 26, 2003. Project Team. Steering Committee Carl Andersen, FHWA Travis Bridewell, VDOT Richmond Dist. Pamela Brookes, VDOT-TED Butch Cubbage, VDOT Richmond Dist.

E N D
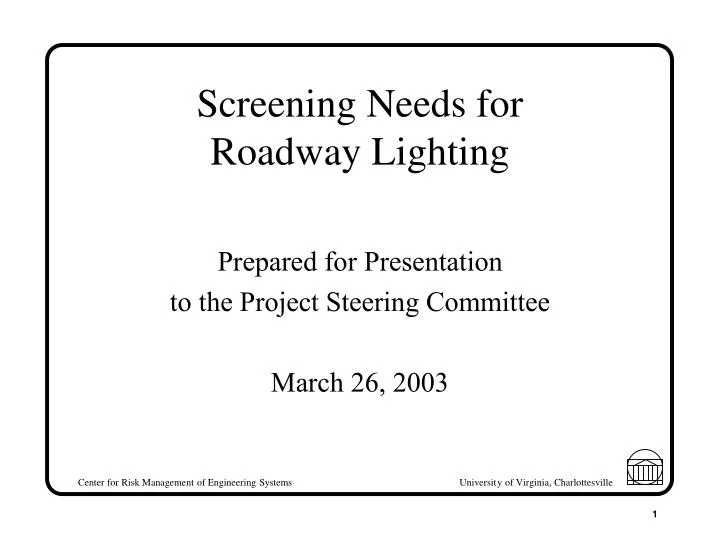
Screening Needs for Roadway Lighting Prepared for Presentation to the Project Steering Committee March 26, 2003
Project Team Steering Committee Carl Andersen, FHWA Travis Bridewell, VDOT Richmond Dist. Pamela Brookes, VDOT-TED Butch Cubbage, VDOT Richmond Dist. Mark Hodges, VDOT-TED Karen Rusak, VDOT-TED Jon Sayyar, VDOT-TED Al Smith, VDOT-TED Benjamin Cottrell, VTRC Wayne Ferguson, VTRC Michael Perfater, VTRC Jim Havard, IES
Project Team (cont.) Technical Assistance Robert Rasmussen, VDOT-TED Ralph Jones, VDOT-TED Robert Feldman, VDOT Richmond Dist. Llewellyn Slayton, VDOT Richmond Dist. Timothy Rawls, VDOT Hampton Roads Dist. Ray Khoury, VDOT Hampton Roads Dist. Jaroslaw Jastrzebski, VDOT Nothern Virginia Dist. Jim Gillespie, VTRC
Project Team (cont.) Center for Risk Management of Engineering Systems Department of Systems and Information Engineering, University of Virginia James Lambert, Research Assistant Professor of Systems Engineering and Center Associate Director (lambert@virginia.edu, (434) 982-2072, fax 924-0865) Yacov Haimes, Professor of Systems Engineering and Civil Engineering and Center Director Thomas Turley, M.S. Student Raynelle Deans, B.S. Student Andrew Miller, B.S. Student Jenny Murrill, B.S. Student James Sanders, B.S. Student
Outline • Background • Methodology development • Overview of the screening method • Exposure assessment • Site parameters assessment • Data analysis to support the screening method • Example • Conclusions and recommendations
Background • Causes of higher nighttime crash rate • Low light level affecting visual capabilities • Increased alcohol usage • Fatigue • Over-representation of young drivers • Nighttime fatality rate three times day fatality rate • About 15,000 lives could have been saved if nighttime crash rate could have been reduced to daytime crash rate in 1993 only Source: CIE 1992 report-Road lighting as an accident countermeasure
Background (cont.) • Potential positive impacts of fixed roadway lighting • Reduction of nighttime accident rate • Increased safety for pedestrians • Facilitation of traffic flow • Inspiration of community growth • Aid to police protection • Promotion of business Source: AASHTO 1984 - An informal guide to roadway lighting
Background (cont.) • Potential negative impacts of fixed roadway lighting • Light pollution • Light reflected form roads causing sky to glow • Aesthetic effect caused by clutter • Energy waste • Glare Source: Environmental Effects of Roadway Lighting – By: Carl Shaflik, August 1997
Background (cont.) • A warrant is a ”factual evidence” that there is reason for a proposed project • Meeting a warrant does not obligate the agency to undertake the project • Proposed project should be considered further in view of what resources are available, the traffic, the severity of hazards, and other considerations Source: USDOT/FHWA (1978)
Background (cont.) • NCHRP warrants • Weighted score method • Burdensome level of detail • Diminished relevance since 1970’s Source: NCHRP (1974)
Background (cont.) AASHTO warrant for complete interchange lighting CIL-1 Traffic entering and leaving the freeway • ADT > 10,000 urban conditions • ADT > 8,000 suburban conditions • ADT > 5,000 rural conditions CIL-2 Traffic on crossroad • ADT > 10,000 urban conditions • ADT > 8,000 suburban conditions • ADT > 5,000 rural conditions CIL-3 When existing substantial commercial or industrial development, which are lighted at night, is located in immediate vicinity of the interchange Where the crossroad approach legs are lighted for ½ mile or more on each side of the interchange CIL-4 Ratio of night to day accident rate is 1.5 or higher than the statewide average for unlighted similar section and studies show a significant reduction in nighttime accident when lighting is introduced Source: AASHTO 1984 - An Informational Guide for Roadway Lighting
Background (cont.) • General understanding of the issues of fixed roadway lighting are studied in Wilken et al. (2001), Kramer (1999, 2001), ANSI (2000), Cottrell (2000), Edwards (2000), IES (2000), Walton (2000), Watson (2000), Gransberg (1998), Sandhu (1992), APWA (1986), Janoff (1984, 1986). • Safety benefits of lighting are investigated in Dewar and Olson (2002), Griffith (1994), Box (1989, 1972), Trivedi (1988), Janoff (1984, 1986), and Marshall (1970)).
Background (cont.) • Understanding of benefit-to-cost methods is provided by IADOT (2001), NYMTC (2001), McFarland and Walton (2000), Janoff and McCunney (1979). • Understanding of fixed roadway lighting design and engineering is found in Staplin et al. (2001), Khan et al. (2000), Garber (2000), Couret (1999), Crawford (1999), Shaflik (1997), Jefferson (1994), FHWA (1993), and Janoff and Zlotnick (1985).
Background (cont.) • The International Commission on Illumination (CIE 1990) summarizes more than sixty accident studies from fifteen countries focused on the benefits of roadway lighting. • % reduction of nighttime crashes for before-after study of lighting
Goal Risk assessment and management methodology for the screening of needs for fixed roadway lighting
Methodology Development Overview of screening methodExposure assessmentSite parameters assessment
Exposure Assessment (cont.) Accepted Marginal Rejected
Site Parameters Assessment • Evolution of NCHRP (1974) screening method • Develop new factors • Combine redundant factors • Discard unnecessary factors • Revise factor scales from “1, 2, 3, 4 or 5” to “Low”, “Moderate” or “High”
Site Parameters Assessment (cont.) • Visibility-loss scenarios
Methodology Development Exposure assessment Site parameters +
Data Analysis to Support the Screening Method Unlighted nodes studyUnlighted two-mile sections studyUnlighted half-mile sections study
Unlighted Nodes Study • Study of unlighted nodes in Richmond District • Input data: • All crashes from 1/1/1997 through 12/31/2001 • 122,126crashes (total) • 83,467 daylight • 38,659 nighttime • 12,163nighttime, unlighted Source: data provided by Bob Rasmussen and Ralph Jones, VDOT
Unlighted Nodes Study (cont.) • Analysis of the 37 nodes with the highest number of crashes
Unlighted Nodes Study (cont.) • Selection of 37 unlighted nodes with higher number of crashes
Unlighted Nodes Study (cont.) • Selection of 37 unlighted nodes with highest number of crashes
Unlighted Nodes Study (cont.) • Selection of 48 nodes with highest night-to-day crash rate ratios
Unlighted Nodes Study (cont.) • Highest night-to-day crash rate ratios occur primarily with AADT from 15,000 to 23,000 • 75% of night-to-day crash rate ratios are between 1.0 - 2.0
Unlighted Two-Mile Sections Study • Study of a selection of unlighted two-mile sections in Richmond, Northern Virginia and Hampton Roads districts • Night and day crashes on the 50 two-mile sections considered for a six years period from 01/01/96 to 12/31/01
Unlighted Two-Mile Sections Study (cont.) Indirect night-to-day crash rate ratio estimation for three districts
Unlighted Two-Mile Sections Study (cont.) Richmond district: unlighted two-mile sections
Unlighted Two-Mile Sections Study (cont.) Northern Virginia district: unlighted two-mile sections
Unlighted Two-Mile Sections Study (cont.) Hampton Roads district: unlighted two-mile sections
Unlighted Half-mile Sections Study • Scaling impact on calculation of crash rate • Division of a sample of two-mile sections into half-mile sections “Minimal” length of section to be lighted Crash Dangerous spots of the section
Unlighted Half-mile Sections Study (cont.) • Small range of half-mile night-to-day crash rates • No evidence that any particular half-mile section had an unusually high night-to-day crash rate
Data Analysis (cont.) Summary of all unlighted nodes and unlighted two-mile sections