Download
1 / 28
280 likes | 383 Views
Long-term stability of Swiss neutron monitors. Rolf Bütikofer and Erwin O. Flückiger University of Bern, Switzerland. J.W. Bieber, J. Clem, D. Desilets, P. Evenson, D. Lal, and R. Pyle, “Long-term decline of South Pole neutron rates”, JGR, Vol. 112, A12102, 2007 1997 peak rate of South Pole NM

E N D
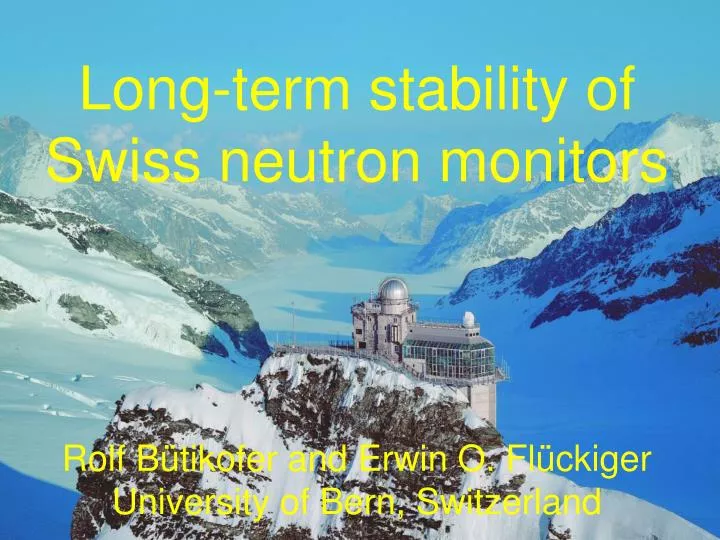
Long-term stability of Swiss neutron monitors Rolf Bütikofer and Erwin O. FlückigerUniversity of Bern, Switzerland
J.W. Bieber, J. Clem, D. Desilets, P. Evenson, D. Lal, and R. Pyle, “Long-term decline of South Pole neutron rates”, JGR, Vol. 112, A12102, 2007 1997 peak rate of South Pole NM was ~8% lower than 1965 peak rate Motivation
Is South Pole NM Count Rate Decrease Instrumental? • Barometer drifts • Changing relative height of NM and Barometer • Detector tube aging • Operating temperature • Electronic and physical background • Environmental change
South Pole Neutron Monitor • 3-NM64 neutron monitor • Location: 90°S, 0°E • Altitude: 2820 m asl • Cutoff rigidity, Rc: ~0.05 GV • Count rate (1997 epoch):~106 counts per second per tube
Swiss Neutron Monitors • University of Bern, Switzerland operates 3 NMs: • 18-IGY NM at Jungfraujoch, 3570 m asl, since 1958. Count rate: ~9 cts per seond per tube (1997) • 3-NM64 NM at Jungfraujoch, 3475 m asl, since 1986 • (Nov. 1964 – Dec. 1977, Pic du Midi, 2860 m asl) Count rate: ~124 cts per seond per tube (1997) • Special Neutron Monitor at Bern, 570 m asl, since 1977 Count rate: ~1 cts per seond per tube (1997)
18-IGY Neutron Monitor Jungfraujoch Roof of Sphinx building IGY NM
3-NM64 Neutron Monitor Jungfraujoch Roof of Research Station
Special Neutron Monitor Bern Roof of Physics Institute, University of Bern
Jungfraujoch IGY NM64
NMs Kiel and Oulu • Kiel 18-NM64, 54 m aslRc ~2.4 GVCount rate: 6 cts per sec per tube (1997) • Oulu 9-NM64, 0 m aslRc ~0.85 GVCount rate: 12 cts per sec per tube (1997)
Change in peak rate 1965 to 1997 1965 to 2008: Jungfraujoch IGY: -5.9% -3.6% Kiel: -2.9% -2.8% Oulu: -1.5% +0.9%
1997 peak rate of South Pole NM was ~8% lower than 1965 peak rate Peak rate decrease 1965-1997:JJ IGY: ~6%, Kiel: ~3%, Oulu: ~2% Peak rate decrease1965-2008: JJ IGY: ~4%, Kiel: ~3%, Oulu (increase): ~1%Corresponding to JJ IGY: -0.08%/a, Kiel: -0.07%/a, Oulu: +0.02%/a Changes in cutoff rigidities during time period 1958-2008 cause only a small change in NM count rates JJ NM64: -0.15%/a (from comparison with Bern NM) An observable aging of counter tubes can not be excluded over periods of decades Conclusions