Download
1 / 16
160 likes | 243 Views
Expected Value and Standard Error for a Sum of Draws (Dr. Monticino). Assignment Sheet. Read Chapter 17 Assignment #10 (Due Monday April 11 th ) Chapter 17 Exercise Set A: 1,2,4,6 Exercise Set B: 1,2,4 Exercise Set C: 1,2,3,5,7 Exercise Set D: 1-3 Exercise Set E: 1,3,6

E N D
Expected Value and Standard Errorfor a Sum of Draws(Dr. Monticino)
Assignment Sheet • Read Chapter 17 • Assignment #10 (Due Monday April 11th ) • Chapter 17 • Exercise Set A: 1,2,4,6 • Exercise Set B: 1,2,4 • Exercise Set C: 1,2,3,5,7 • Exercise Set D: 1-3 • Exercise Set E: 1,3,6 • Review Exercises: 1-4,7,9,12 • Quiz 9 will be over Chapter 16 and possibly part of Ch 17 • Test 2 over Chapters 13 - 18 is scheduled for April 13th
Overview • Expected value • For a single draw • For a sum of draws • Standard deviation • Short cut • For a single draw • For a sum of draws: Standard Error • Relation to the normal distribution
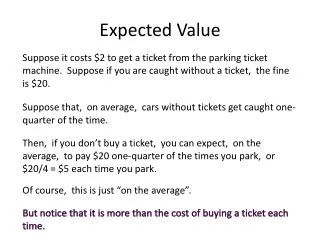
Expected Value • For a single draw or a single repetition of a random process • Suppose that a random process produces values x1,x2,...xn with probabilities p1,p2,...,pn. • The expected value of the process is the weighted average p1*x1 + p2*x2 +...+ pn*xn • If a box model of the process is constructed, then expected value is just the average of the box • Examples • Suppose a box model contains three –5 tickets and two +10 tickets • Flip a fair coin, win $1 if heads comes up, lose $1 if tails comes up • Bet $1 on “17” in roulette, win $35 if the number comes up
Expected Value • If the process is repeated N times, then expected sum = expected value for the sum = (expected value for one repetition)N • Examples • Draw 20 times from a box model that contains three –5 tickets and two +10 tickets • Flip a fair coin 5 times, win $1 if heads comes up, lose $1 if tails comes up • Bet $1 on “17” in roulette 10 times, win $35 if the number comes up
Standard Deviation • For a single draw or a single repetition of a random process • Suppose that a random process produces values x1,x2,...xn with probabilities p1,p2,...,pn. Let denote the expected value • The standard deviation of the process is • If a box model of the process is constructed, then the standard deviation is just the standard deviation of the box • Just calculate the SD of the list of numbers
Standard Deviation • Short cut method for finding standard deviation of a single draw or a single repetition • See page 298 • You may use this method freely • It can be shown that this method is equivalent to using:
Standard Deviation • Examples • Suppose a box model contains three –5 tickets and two +10 tickets • Flip a fair coin, win $1 if heads comes up, lose $1 if tails comes up • Bet $1 on “17” in roulette, win $35 if the number comes up
Standard Error • If the process is repeated N times, then the standard error (standard deviation for the sum) is equal to • If the process is repeated N times, then the sum is likely to be around expected sum standard error
Standard Error • Examples • Draw 20 times from a box model that contains three –5 tickets and two +10 tickets • Flip a fair coin 5 times, win $1 if heads comes up, lose $1 if tails comes up • Bet $1 on “17” in roulette 10 times, win $35 if the number comes up
Normal Approximation • Observed sums are usually within 2 to 3 SE’s away from the expected sum • When the number of draws is large, the distribution of the sum is approximately normal with mean equal to the expected sum and standard deviation equal to the standard error
Binomial to Normal • Suppose that you play “red-black” in a Nevada casino • You always bet on red; bet $1 each time; play two times • What is your probability of at least breaking even? • Using binomial probabilities: At least breaking even means winning at least once
Binomial to Normal • Play red-black again, always bet on red; bet $1 each time; now play ten times • Probability of at least breaking even is the probability of winning at least five times
Binomial to Normal • Again play red-black again, always bet on red; bet $1 each time; now play fifty times • Probability of at least breaking even is the probability of winning at least twenty-five times
Binomial to Normal • Binomial probabilities for 2 plays, 10 plays, 50 plays, 100 plays
Normal Approximation • Suppose that you play “red-black” in a Nevada casino • You always bet on red • Bet $1 each time • Play 500 times • What is your probability of • At least breaking even • Winning more than $50 (Dr. Monticino)