Download
1 / 26
260 likes | 354 Views
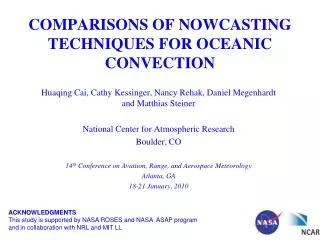
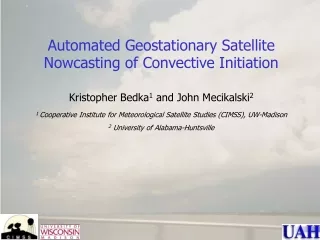
Satellite Based Nowcasting of Convection Initiation and Data Assimilation. John R. Mecikalski 1 , Kristopher M. Bedka 2 Simon J. Paech 1 , Todd A. Berendes 1 , Wayne M. Mackenzie 1. 1 Atmospheric Science Department University of Alabama in Huntsville

E N D
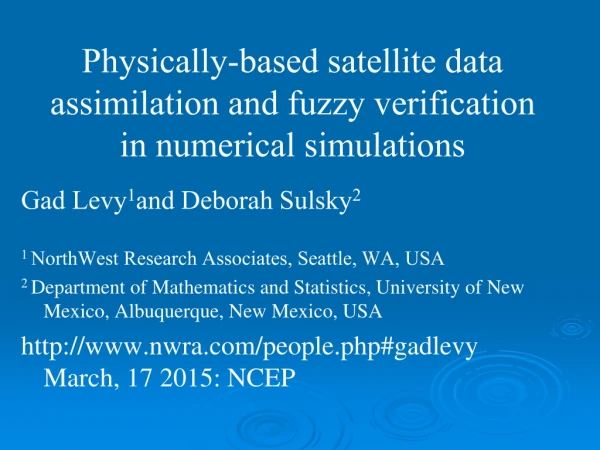
Satellite Based Nowcasting of Convection Initiation and Data Assimilation John R. Mecikalski1, Kristopher M. Bedka2 Simon J. Paech1, Todd A. Berendes1, Wayne M. Mackenzie1 1Atmospheric Science Department University of Alabama in Huntsville 2Cooperative Institute for Meteorological Satellite Studies University of Wisconsin-Madison Supported by: NASA New Investigator Program (2002) NASA ASAP, SERVIR & SPoRT Initiatives
Outline • Convective Initiation research, validation & transition activities • NWS Products • Soil Moisture Initialization Research (data assimilation) • New Research, with NASA Data (lightning, MAMVs)
Ambient Environment: Freezing level (i.e. tropical vs. midlatitude) CAPE (also, its shape) Models/ Sounders Cumulus: Cloud-top T Cloud growth rate Cloud glaciation Freezing level: warm rain process ice microphysics Interactions with ambient clouds (pre-existing cirrus anvils) Satellite: VIS & IR CI What are the factors? LMA & NLDN Lightning: Type (CG, IC, CC) Amount Polarity Altitude in clouds with respect to anvil Courtesy, NCAR RAP
Where We Are Now • Applying CI algorithm over U.S., Central America & Caribbean • SATCAST/Flat ADAS to NWS HUN & MKX • SATCAST to NOAA/NESDIS & SPC • Validation & Confidence analysis • Satellite CI climatologies/CI Index: 1-6 h • Work with new instruments • Hydrological applications
Parallax Shift CI Nowcast Validation • Like any satellite-based weather decision-support product, false alarms do occur with the SATCAST nowcasting product • VIS/IR Satellite observations only provide a “view from the top” and cannot retrieve in-cloud dynamics or thermodynamics, which can greatly influence cumulus evolution • Cloud tracking errors using MESO AMVs • An objective quantitative validation of the SATCAST nowcast product is challenging for several reasons 1) Parallax viewing effect causes difficulty in matching satellite observations with radar observed precipitation fields 2) Objective synchronization of current satellite cloud growth trends with future radar observations 3) Satellite navigation issues
SATELLITE AMV WOULD INCORRECTLY FORECAST FUTURE RADAR ECHO LOCATION
CI Nowcast Validation Conditional POD skill scores
CI Nowcast Validation Conditional FAR skill scores
SATCAST Algorithm “Interest Field” Importance • Deep convection, dry upper troposphere. • Best for high CAPE environments, and strong updrafts. • Winter-time, Midlatitudes
SATCAST Algorithm “Interest Field” Importance • Moist upper troposphere, “warm-top” convection. Shallow convection. • Low CAPE environments (tropical, cold-upper atmosphere). f(Physics) • Optimal in Tropics during summer.
SATCAST Algorithm “Interest Field” Importance: POD/FAR • Use of 8.5-11 & 3.7-11 m from MODIS have been considered • Instantaneous 13.3–10.7 um:Highest POD (88%) • Cloud-top freezing transition:Lowest FAR (as low as 15%) • Important for CI & Lightning Initiation
NWS Transition Activities SATCAST in AWIPS U. Wisconsin - CIMSS collaboration Web Survey 2007 NESDIS Operations
Outline • Convective Initiation research, validation & transition activities • NWS Products • Soil Moisture Initialization Research (data assimilation) • New Research, with NASA Data (lightning, MAMVs)
NWS Transition Activities Flat ADAS for Surface Analyses Flat ADAS
NWS Transition Activities Mesoscale AMVs: 2007-2008
NWS Transition Activities CI “Trends of Trends”: 2007-2008
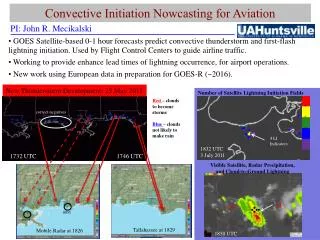
Satellite-Lightning Relationships • Current Work: Develop relationships between IR TB/TB trends and lightning source counts/flash densities toward nowcasting (0-2 hr) future lightning occurrence • * Supported by the NASA New Investigator Program Award #:NAG5-12536 Northern Alabama LMA Lightning Source Counts 2040-2050 UTC 2047 UTC 2147 UTC 2140-2150 UTC kkoooooooookkkkkkkkkkk
CI Climatology Research GOES CI Interest Fields: 21 July 2005 (afternoon) Details: -topography -main updrafts …for LI 1 km Resolution
GOES-R Risk Reduction Semi-Transparent Cirrus Java-based Hydra Visualization Tool Deep Cu/Ice Cloud 8.5-11 μm Difference 8.5-11 m Difference vs IR Window TB IR Window TB Multispectral cloud properties are used to classify cumulus and identify clouds in a pre-CI state Cirrus Edge/Mid-Height Cu Clear Sky/Small Cu
GOES-R Risk Reduction Preliminary MSG CI Nowcasting Criteria • Microphysical information from 1.6 reflectance is used to improve the convective cloud mask and negative 8.7-10.8 m differencing values are used to identify cumulus with liquid water tops
a) b) c) d) e) f) MODIS/GOES Convective Cloud Mask Validation GOES Convective Cloud Mask MODIS Convective Cloud Mask Visible Channel GOES Convective Cloud Mask MODIS Convective Cloud Mask Visible Channel
a) b) c) d) e) f) MODIS/GOES Convective Cloud Mask Validation MSG Convective Cloud Mask MODIS Convective Cloud Mask Visible Channel In preparation for GOES-R Visible Channel MSG Convective Cloud Mask MODIS Convective Cloud Mask
1 Aug 2004 Soil Moisture Differences ALEXI - EDAS 0-10 cm 10-40 cm • The largest differences between ALEXI and EDAS soil moisture occur over the eastern half of the study domain • The 40-100 cm soil layer shows that ALEXI soil moisture is wetter across a majority of the domain 40-100 cm 100-200 cm • The drier conditions in the 100-200 cm soil layer are once again in a region where vegetation is not able to extract water from the soil. The wetter conditions in SE OK are located within vegetation types which can extract water from this layer.
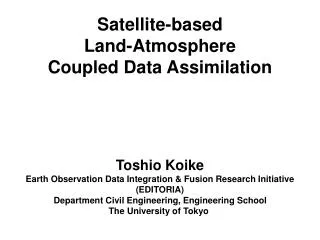
ALEXI and EDAS Comparisons The retrieval of ALEXI soil moisture is compared to soil moisture observations from the Eta Data Assimilation System (EDAS) for each of the composite periods. The EDAS soil moisture show substantial dry biases, with the largest bias occurring during observed wet soil moisture conditions (high fPET). With respect to all observations during this period, the ALEXI soil moisture retrieval produces soil moisture estimates that exhibit a much lower RMSE than EDAS. RMSE = 0.059 or 19.7% fAW RMSE = 0.095 or 31.7% fAW EDAS ALEXI
Future Work • Continue AWG GOES-R Risk Reduction • Further Satellite based lightning initiation research using GOES, MODIS & MSG • Thru NASA SERVIR, provide more hydrologic information from SATCAST • Using MODIS NDVI product and topography maps, improve nowcasting 0-3 hours using vegetation and topography to determine areas where CI may occur. [John Walker, UAH] • CloudSat, MODIS & QuikSCAT for convective momentum fluxes and mesoscale AMV assimilation [Chris Jewett, UAH] • Peer-reviewed papers • Additional soil moisture assimilation work: AMSR+MODIS via ALEXI [Chris Hain, UAH]; with the USDA • Convective Climatologies [2 UAH Graduate Students] • Collaboration with SPC [late 2007] & NOAA NESDIS • Continued SATCAST validation + transfer of MAMVs to NWS Huntsville