Download
1 / 26
260 likes | 353 Views
EBTJV Project Overview. Riparian planting tool Brook trout habitat patch layer. Riparian Planting Tool. Purpose To help locate & prioritize locations where tree plantings would be most beneficial Data Canopy cover layer (30 M raster) Solar radiation layer (30 M raster)

E N D
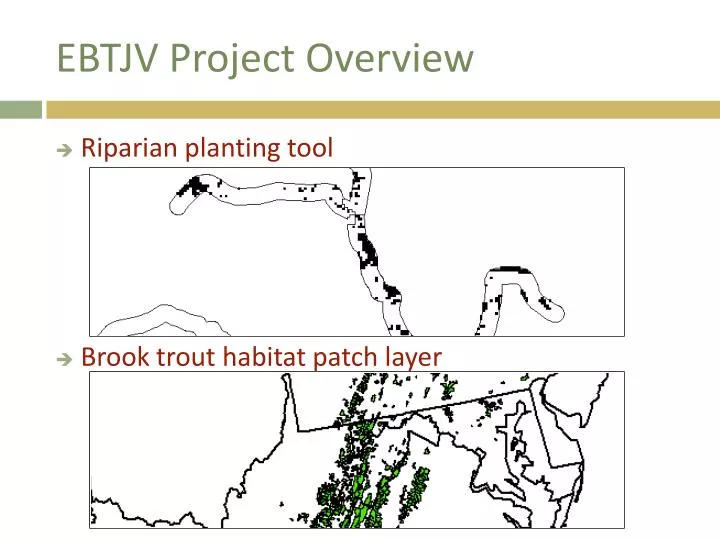
EBTJV Project Overview • Riparian planting tool • Brook trout habitat patch layer
Riparian Planting Tool • Purpose • To help locate & prioritize locations where tree plantings would be most beneficial • Data • Canopy cover layer (30 M raster) • Solar radiation layer (30 M raster) • NHD+ Stream layer w/ 100 M buffer • End Product • Web-based GIS tool
Riparian Planting Tool • Web-tool features • User-specified threshold values • % Canopy cover • <= 70% • % Rank of solar radiation • >= 75% • User-specified spatial extent • Select based on various geographic & hydrologic layers • Maryland • Brook trout habitat patch • Makes ranking of solar radiation values more relevant
Riparian Planting Tool • Currently developing web-tool • Will be housed on Appalachian LCC website • Suggestions for new/improved features
Habitat Patch Layer • Purpose • To update initial brook trout assessment performed at the sub-watershed scale to the catchment scale • Data • NHD+ Catchment layer • State trout sampling data • Dams/Lakes layer • End Products • Brook trout habitat patch layer • NHD+ catchment layer w/ trout occurrence labels
Current Patch Layer • Current patch layer completed for PA south • Requested data from remaining states in April
Habitat Patch Layer • Currently writing script to automate process • Speed up analysis/reduce error • Patches more numerous in northern states • Reproducable • Enable retrospective analysis • Produce patch layers through time • Quantify patch loss • Establish framework for future analyses • Occupancy models • Catchments assigned probability of having brook trout
Field Testing • Determine if “patch” is appropriate scale • Do large patches contain multiple populations • Sample patches over range of sizes • Explain patch effective number of breeders (Nb) by patch size
Patch Size & Populations 1,217 Ha 10,880 Ha 3,807 Ha
Sampled Patches • Size range • 509 to 11,570 Ha • Used sub-sampling strategy detailed in Whiteley et al 2012
Preliminary Patch Nb Results Habitat remediation/Stable Summer flows Sympatric with Rainbow trout
VA Patches Sampled Patches Prioritized Patches Unsampled Patches
Field Testing Conclusions • Patch proper scale for brook trout management • Layer for entire brook trout range in development • Nb predictive model appears feasible • Outliers have reasonable explanations • Continue to add patches & develop model
Acknowledgements Matt Burak, Maili Page & Gonzalo Mendez conducted genetic analyses The following organizations provided financial assistance or volunteer support: James Madison UniversityGeorge Washington and Jefferson National ForestVirginia Department of Game and Inland Fisheries U.S. Forest Service, Northern Research Station University of Massachusetts Amherst U.S. Geological Survey, Leetown Science CenterConte Anadromous Fish Research Laboratory
PopulationMonitoring • Genetics • Nb – Effective number of breeders • Combines number of parents and family size • Lower values = fewer parents and/or skewed family sizes
Brook Trout Patches Virginia Patches (n = 331) Average size = 1,541 ha Median size = 855 ha
Nb-to-Ne relationship • Used two FG YOY samples (2004, 2010) • Temporal Ne (Wang & Whitlock 2003) • Estimated Ne: 201.1 • Single-sample estimated Nb: 111.6 • Ne = gxNb= 1.91 x 111.6 = 213.2 • g from Letcher et al. 2007
Sampling Strategies for Estimating Brook Trout Effective Population Size Jason Coombs – University of Massachusetts Andrew Whiteley – University of Massachusetts Mark Hudy – U.S. Geological Survey Zachary Robinson – University of Massachusetts Amanda Colton – U.S. Forest Service Ben Letcher – U.S. Geological Survey Keith Nislow – U.S. Forest Service