Download
1 / 17
170 likes | 298 Views
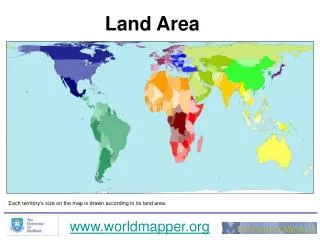
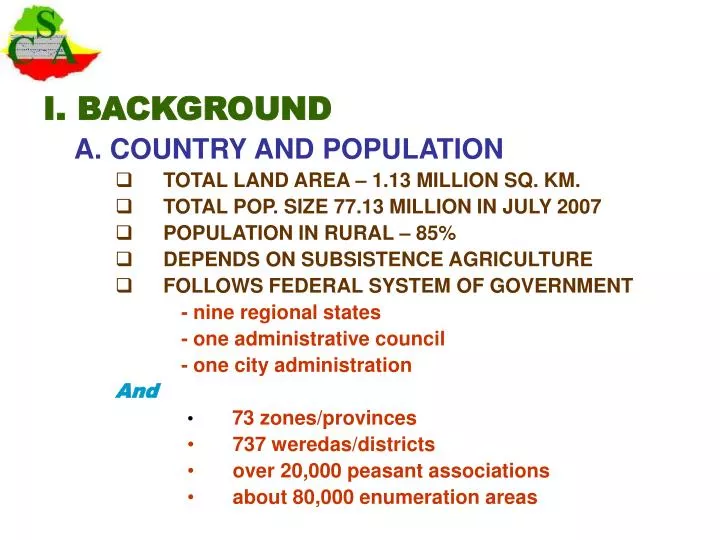
I. BACKGROUND A. COUNTRY AND POPULATION TOTAL LAND AREA – 1.13 MILLION SQ. KM. TOTAL POP. SIZE 77.13 MILLION IN JULY 2007 POPULATION IN RURAL – 85% DEPENDS ON SUBSISTENCE AGRICULTURE FOLLOWS FEDERAL SYSTEM OF GOVERNMENT - nine regional states

E N D
I. BACKGROUND A. COUNTRY AND POPULATION • TOTAL LAND AREA – 1.13 MILLION SQ. KM. • TOTAL POP. SIZE 77.13 MILLION IN JULY 2007 • POPULATION IN RURAL – 85% • DEPENDS ON SUBSISTENCE AGRICULTURE • FOLLOWS FEDERAL SYSTEM OF GOVERNMENT - nine regional states - one administrative council - one city administration And • 73 zones/provinces • 737 weredas/districts • over 20,000 peasant associations • about 80,000 enumeration areas
B. AGRICULTURE • Means of livelihood for 85% of population • Accounts 46% of the GDP • Employs 85% of the labor force • Generates 85% of commodity export • Provides raw materials for 70% of large & medium scale industries Hence, govt. put in place a new economic policy in 1991- “Agriculture Development Led Industrialization (ADLI)” And this demands a comprehensive and up to date agricultural data for effective implementation of development programs.
II. ORGANIZATION OF STATISTICAL SERVICES IN ETHIOPIA A. BACKGROUND • Prior to 1957, no coordinating body for statistical work • Data compiled on ad- hoc basis by different ministries • IN 1957, the First Five Year Plan was drafted (1957- 1962 • Oct. 1959 – the first Conference of African Statisticians was held in A.A. • This initiated the creation of coordinated and systematic statistical service
B. ESTABLISHEMENT OF THE CENTRAL STATISTICAL OFFICE • June 1960, CSO started functioning as a statistical unit in the then Ministry of Commerce • January 1963, CSO was established as an independent office and the regular stat. activities became its mandate • 1970, Issuance of Statistical Law and 1972 some amendments: In accordance with the Law, CSA is responsible to • Collect, organize, publish and disseminate statistical data • Render statistical service • Assist govt. organs and regional administration to matters pertaining to the collection, organization, analysis and preparation of publication and dissemination of stat. data • 1987, upgraded to a level of Authority named CSA under MEDaC • 1989, restructured to an Agency under MoFED
C. ROLE OF THE MINISTRY OF AGRICULTURE AND RURAL DEVELOPMENT (MoARD) • Under Proc. No. 41/1993 • Undertakes studies and research, collect and compile statistical data • Give assistance and advice to regional Agricultural Bureaus • Through the Development Agents of the regional bureaus, collects and compiles agricultural data related to its development activities • 2-3 Agricultural Development Agents are assigned in each Peasant Association( about 49,000 DAs are available)
III. FOOD AND AGRICULTURAL STATISTICS SERVICE 3.1 Agricultural Market Information System • CSA conducts monthly retail prices and producers’ sample survey • Major groups of items covered are • food • Drinks • Tobacco • Stimulants • Household equipment • Etc. • Using monthly survey data, quarterly statistical report and monthly country and regional levels consumer price indices has been produced
3.2 Agricultural Surveys and Censuses • Prior to 1974 • Agricultural data inadequate with respect to • Coverage • Timeliness • Reliability • Data collection activity was uncoordinated • different institutions were involved, such as CSO, MoA, Ethiopian Grain Board, National Coffee Board, etc. • Ad-hoc data collection
During 1974-1979 • MoA was involved in conducting agricultural sample surveys on crop and livestock statistics • FAO provided some technical assistance • Six nation wide agricultural sample surveys were conducted • the survey data content and coverage has shown significant improvement compared to previous attempts • Data on – crop area and production - livestock - farm buildings and implements were collected, compiled and disseminated
1980-2001 • In 1980, collecting, compiling and dissemination of food and agricultural statistics activities, with the manpower and logistical resources in the MoA was transferred to CSO • The same year, the National Integrated Household Survey Program was initiated by CSA with the assistance of FAO/UNDP and UNCEF • Under Integrated System of Food and Agricultural Statistics Program (ISFASP), efforts have been made to produce timely and reliable food and agricultural data • The NIHSP paved the way for the establishment of a permanent annual statistical survey program • During this period 21 Agri. Sample Surveys were conducted • The annual agri. surveys include • the Crop Product Forecast Sample Survey • the Main Season Sample Survey • the Livestock Sample Survey • and the Belg Season Sample Survey
CONT. • Based on these surveys, the following statistical reports have been produced and disseminated : • Crop Production Forecast (November) • Volume I: Area and Production of Temporary Crops- main season (April) • Volume II: Livestock, Poultry and Beehives Statistics (February) • Volume III: From Management Practices-Main Season (May) • Volume IV: Land Utilization (May) • Volume V: Area Production and Yield of Temporary Crops-Belg Season (August) • Volume VI: Farm Management Practices-Belg Season (August)
Limitations of the Sample surveys • Subject coverage • Survey excludes vegetables, root crops and perennial crops • Area coverage • excludes pastoralist areas • excludes agricultural activities in urban centres • Sector coverage • Large and Medium Scale Commercial Farms were not included • Reporting domain • The reporting domains are zones (provinces) and not able to produce results at wereda (district) level because of limitation in sample size
2001 – to date i)The 2001/02 Ethiopian Agricultural Sample Enumeration - is the first ever for the country - since then it has been serving as benchmark data Subject coverage - all crops including vegetables, root crops and perennial crops Area coverage - cover both the sedentary and pastoralist areas - cover the agricultural activities in the urban areas Sector coverage - both private peasant and large and medium scale commercial farms Reporting domain - weredas/districts were the reporting domains ii) Annual Agri. Sample Surveys since 2001/02 - regarding subject and sector coverage, similar to the 2001/02 EASE - sedentary and semi-pastoralist areas are coverd - zones/provinces are the reporting domain
3.3 Food consumption statistics • Since 1980, three National Household Income, Consumption and Expenditure sample surveys have been conducted • the latest was in 2004/05 • The result have been used for analyzing the changes in the levels of living standards of households overtime in various socio-economic groups 3.4 Early Warning and Food Crops Forecasting System • Moard, Regional Agriculture Bureaus and DPPA are involved in crop assessment and monitoring • The NMA also involved in providing agro-met information • CSA, through the crop production forecast survey, provides data on expected crop production for the govt. prior to harvest
IV. STRENGTHS, WEAKNESSES AND CONSTRAINTS OF THE CURRENT SYSTEM 4.1 Strengths • since 1980, permanent statistical system • apply a technically sound sample design for the various socio-economic surveys including agriculture (two-stage stratified cluster sampling) • application of objective measurement for area and productivity) • strong and well distributed statistical branch offices to facilitate data collection at field level • efficient application of the available data processing technology • start establishing networking and database
4.2 Weaknesses and Constraints • lack of methodology/technique to produce • food and agri. Data at lower administrative level • weak coordination among data producing institutions • incomplete dependable conversion coefficients for local measurement units • difficulty in constructing appropriate sampling frame for pastoralist areas • weak system in the development of fisheries, forestry and environment statistics
V. RECENT DEVELOPMENT • Increase cooperation with regional and federal stakeholder institutions • Start pilot exercise on small area estimation techniques with technical assistance from FAO/EU • Start working on the development of area sampling frame, GIS and satellite imagery application with technical assistance from FAO • Progress has been made on developing standard conversion coefficient for local area and prod. measurement units • Network connectivity between CSA HQ. and branch offices is underway with the support of WB and FAO