Download
1 / 34
340 likes | 446 Views
Concentric Circle Liver Distribution Models. Julie Heimbach, MD Transplant surgeon, Mayo Clinic UNOS Liver Committee. MA. RI. DE. MD. PR & US VI. HI. Current Distribution Unit 58 OPO/Donor Service Areas. Arbitrary, with wide variability in size, and population

E N D
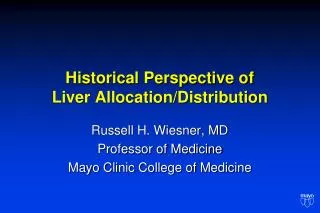
Concentric Circle Liver Distribution Models Julie Heimbach, MD Transplant surgeon, Mayo Clinic UNOS Liver Committee
MA RI DE MD PR & US VI HI Current Distribution Unit 58 OPO/Donor Service Areas Arbitrary, with wide variability in size, and population (1.3 - 18.7 million people.)
Background • During last year’s public comment period for broader sharing, multiple regions/individual public comments suggested looking instead at concentric circle model. • This has been the long-standing model used in thoracic transplantation, modified in 2006 for hearts.
HEART DISTRIBUTION UNITS ZONE D: 1500-<2500 miles ZONE C: 1000-<1500 miles ZONE B: 500-<1000 miles ZONE A: < 500 miles LOCAL (DSA) ZONE E: >2500 miles
ALLOCATION ORDERING:Adult donors Local Status 1A Local Status 1B Zone A Status 1A Zone A Status 1B Local Status 2 Zone A Status 1A Zone A Status 1B Zone B Status 1A Zone B Status 1B Zone A Status 2 Zone B Status 2 • Zone C Status 1A • Zone C Status 1B • Zone C Status 2 • Zone D Status 1A • Zone D Status 1B • Zone D Status 2 • Zone E Status 1A • Zone E Status 1B • Zone E Status 2
FOR DEATHS PER 100 PATIENT-YEARS ON THE WAITING LIST: Adult Candidates * Inactive (status 7) is combined with the previous active status ** Deaths include those reported to the OPTN or to SSDMF while on waiting list or within 7 days of non-transplant removal.
SURVIVAL WITHIN 1 YEAR:Adult recipients: All statuses combined NOTE: Scale of survival axis has been expanded.
SURVIVAL WITHIN 1 YEAR:Adult recipients: Status 1A at transplant NOTE: Scale of survival axis has been expanded.
CONCLUSIONS The policy modification appears to be meeting its goals: Waiting list mortality has declined for adult candidates. A larger percentage of transplants are being performed in urgent candidates. Post-transplant survival has not been adversely affected.
Liver Concentric Circle Model: • Using LSAM, the SRTR modeled a system using concentric circles for distribution units for all adult and pediatric donors. • Additional runs were performed with sharing only for MELD > upper thresholds of 35, 32, 29, 25, and 22.
Methods • Study Population • Data from listed candidates and available donor organs from 1/1/2006 to 12/31/2006 were included • Analytical Approach • LSAM was used to compare concentric circles for sharing above various MELD/PELD thresholds versus current. Results= average of 10 separate runs. • Endpoints: • deaths (pre and post) • median distance traveled
1 nm=1.15 mi = 250 nm
1 nm=1.15 mi = 500 nm
Concentric Circles for Adult Deceased Donor Livers– Current System Regional – Status 1A/1B Local – MELD/PELD 15 Regional – MELD/PELD 15 Local – MELD/PELD < 15 Regional – MELD/PELD < 15 National – Status 1A National – Status 1B National – MELD/PELD
Concentric Circles for Adult Deceased Donor Livers– February 2010 Concentric 250: 35 (29, 25, 22) 0-250 NM – Status 1A then 1B 0-250NM – MELD/PELD 35 (29, 25, 22) 250-500 NM – Status 1A then 1B 0-250 NM – MELD/PELD 15-34 (29, 25, 22) 250-500NM– MELD/PELD 35 (29, 25, 22) 0-250NM – MELD/PELD < 15 500-1,000NM – Status 1A then 1B 250-500NM – MELD/PELD 15-34 (29, 25, 22) 500-1,000NM – MELD/PELD 35 (29, 25, 22) 250-500NM – MELD/PELD < 15 1,000+ NM – Status 1A/1B 500-1,000 NM – MELD/PELD < 35 (29, 25, 22) 1,000+ NM – MELD/PELD Note: NM = nautical mile radii (w/ donor hospital at the center)
0-250 NM Status 1A 250-500 NM Status 1A 0-250 NM Status 1B 250-500 NM Status 1B 0-250 NM MELD/PELD 35 (32, 29, 25, 22) 250-500 NM MELD/PELD 35 (32, 29, 25, 22) 0-250 NM MELD/PELD 15-34 (31, 28, 24, 21) 250-500 NM MELD/PELD 15-34 (31, 28, 24, 21) 500-1000 NM Status 1A 500-1000 NM Status 1B 500-1000 NM MELD/PELD 15 1000+ NM Status 1A 1000+ NM Status 1B 1000+ NM MELD/PELD 15 0-250 NM MELD/PELD < 15 250-500 NM MELD/PELD < 15 500-1000 NM MELD/PELD < 15 1000+ NM MELD/PELD < 15 Concentric Circles: March 2010 Con250 15-35 (32, 29, 25, 22) Note: NM = nautical mile radii (w/ donor hospital at the center)
Concentric Circles for Adult DD Livers: March February March Con250 15-35 (32, 29, 25, 22) 0-250 NM Status 1A 250-500 NM Status 1A 0-250 NM Status 1B 250-500 NM Status 1B 0-250 NM MELD/PELD 35 (32, 29, 25, 22) 250-500 NM MELD/PELD 35 (32, 29, 25, 22) 0-250 NM MELD/PELD 15-34 (31, 28, 24, 21) 250-500 NM MELD/PELD 15-34 (31, 28, 24, 21) 500-1000 NM Status 1A 500-1000 NM Status 1B 500-1000 NM MELD/PELD 15 1000+ NM Status 1A 1000+ NM Status 1B 1000+ NM MELD/PELD 15 0-250 NM MELD/PELD < 15 250-500 NM MELD/PELD < 15 500-1000 NM MELD/PELD < 15 1000+ NM MELD/PELD < 15 0-250 NM – Status 1A, then 1B 0-250NM – MELD/PELD 35 (29, 25, 22) 250-500 NM – Status 1A, then 1B 0-250 NM – MELD/PELD 15-34 (29, 25, 22) 250-500NM– MELD/PELD 35 (29, 25, 22) 0-250NM – MELD/PELD < 15 500-1,000NM – Status 1A 500-1,000 NM – Status 1B 250-500NM – MELD/PELD 15-34 (29, 25, 22) 500-1,000NM – MELD/PELD 35 (29, 25, 22) 250-500NM – MELD/PELD < 15 1,000+ NM – Status 1A 1,000+ NM – Status 1B 500-1,000 NM – MELD/PELD < 35 (29, 25, 22) 1,000+ NM – MELD/PELD
Key differences Feb. to March: • Feb: small circle for 1A, then 1B, then for MELD> 35 (or other). big circle for 1A, then 1B. back to the small circle for 15-35, then big circle >35(other), then to small circle for MELD <15. • March: small circle 1A, then big circle for 1A. small circle 1B, then big circle for 1B. small circle >35 (or other lower), big circle >35 0-250 for 15-35, then 250-500 15-35, then national before 0-150 for MELD <15.
Median DistanceBetween Donor Hospital and Transplant Center: February
Median Distance Between Donor Hospital and Transplant Center: March total increase 60-80 mi
Decrease in Total Deaths (vs. Current)- March Overall 83- 105 fewer deaths
Number of Transplants by MELD: March *More 1A, MELD >20. Overall ~110 fewer transplants.
Number of Deaths by Type: March *Overall ~83- 105 fewer deaths, slightly more post TX.
Number of WL Deaths by MELD- March *similar small decrease in WL death in each MELD group
Summary • All of the two tiered concentric circle systems resulted in higher median distances traveled vs. current. • The distance increased as the MELD score for the upper threshold was reduced • All of the two tiered concentric circle systems resulted in fewer total deaths compared to current allocation rules in the simulations. • The decrease in the number of deaths ranged from83 to 105.
Median Distance vs. Decrease in Total Deaths Reg Shr Benefit Five Zones Concentric 250_1525 National 250_1532 250_1529 15/25 15/29 250_1522 15/22 15/35 250_1535 Concentric 35 15/32 Shr Pos Benefit Reg Shr MELD 250_29 250_22 250_35 250_25 Shr35R, National 15 Concentric Current
Flight cost estimates: Life Source (MNOP) 2007-2009 =MNOP (MN, ND, SD) Region 7= MN,SD, ND, WI, IL 2nd Tier =IA, NE, KS, MO, MI, IN • Local (MNOP) flight= $ 5,271 (n=520) • Import region 7 flight= $ 5,617 (n=52) • Import 2nd tier= $ 7,629 (n=22) • Import national= $ 13,273 (n=55)