Download
1 / 54
550 likes | 654 Views
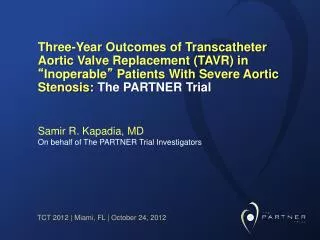
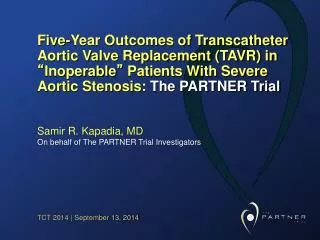
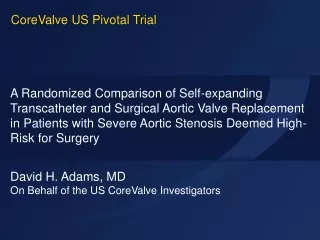
Transcatheter vs. Surgical Aortic Valve Replacement in High Risk Patients with Severe Aortic Stenosis: Results From The PARTNER Trial. Craig R. Smith, MD on behalf of The PARTNER Trial Investigators. ACC 2011 | New Orleans | April 3, 2011.

E N D
Transcatheter vs. Surgical Aortic Valve Replacement in High Risk Patients with Severe Aortic Stenosis: Results From The PARTNER Trial Craig R. Smith, MD on behalf of The PARTNER Trial Investigators ACC 2011 | New Orleans | April 3, 2011
Presenter Disclosure Information for PARTNER at ACC April 3, 2011 Craig R. Smith, MD PARTNER Trial sponsor (Edwards LifeSciences) reimburses customary travel and other expenses
Background • Surgical aortic valve replacement (AVR) is the standard of care for treating patients with symptomatic aortic stenosis who are candidates for operation. • Although transcatheter aortic valve replacement (TAVR) reduces mortality in patients who cannot have AVR, there have been no randomized trials comparing TAVR to AVR in patients who are at high-risk for operation.
Purpose To compare the safety and effectiveness of TAVR (either transfemoral or transapical) to surgical AVR in high-risk, operable patients with symptomatic, severe aortic stenosis.
PARTNER Study Design Symptomatic Severe Aortic Stenosis ASSESSMENT: High-Risk AVR Candidate 3,105 Total Patients Screened Total = 1,057 patients High Risk Inoperable N = 358 N = 699 2 Parallel Trials: Individually Powered ASSESSMENT: Transfemoral Access Yes No 1:1 Randomization Not In Study N = 179 N = 179 TF TAVR Standard Therapy VS Primary Endpoint: All-Cause Mortality Over Length of Trial (Superiority) Co-Primary Endpoint: Composite of All-Cause Mortalityand Repeat Hospitalization (Superiority)
Inoperable PARTNER CohortPrimary Endpoint: All-Cause Mortality • HR [95% CI] =0.54 [0.38, 0.78] • P (log rank) < 0.0001 Standard Rx TAVI • ∆ at 1 yr = 20.0%NNT = 5.0 pts 50.7% All-cause mortality (%) 30.7% Months Leon et al, NEJM 2010; 363:1597-1607
PARTNER Study Design Symptomatic Severe Aortic Stenosis ASSESSMENT: High-Risk AVR Candidate 3,105 Total Patients Screened Total = 1,057 patients Inoperable High Risk N = 358 N = 699 2 Parallel Trials: Individually Powered ASSESSMENT: Transfemoral Access ASSESSMENT: Transfemoral Access Yes No Transapical (TA) Transfemoral (TF) Yes No 1:1 Randomization 1:1 Randomization 1:1 Randomization Not In Study N = 244 N = 248 N = 104 N = 103 N = 179 N = 179 TF TAVR AVR TA TAVR AVR TF TAVR Standard Therapy VS VS VS Primary Endpoint: All-Cause Mortality Over Length of Trial (Superiority) Co-Primary Endpoint: Composite of All-Cause Mortalityand Repeat Hospitalization (Superiority) Primary Endpoint: All-Cause Mortality at 1 yr(Non-inferiority)
Primary Endpoint All-cause mortality at one year • Analysis by intent-to-treat • Event rates by Kaplan-Meier estimates • Crossovers permitted only when assignedtherapy unsuccessful • All patients followed for ≥ one year
Other Important Endpoints (1) Safety: • Neurologic events • Prospective: Stroke and stroke plus TIA (all neuro events) • Retrospective: Major stroke (modified Rankin Score ≥ 2 @ ≥ 30 days) • Major vascular complications (VARC definition) • Major bleeding (modified VARC definition) • Repeat hospitalization • New pacemakers and new-onset atrial fibrillation (ECG core lab) • Procedural events (assigned therapy aborted or converted to AVR, multiple valves, etc.) • Surgical complications (re-op for bleeding, sternal infection, etc.)
Other Important Endpoints (2) Clinical Effectiveness and Valve Performance: • NYHA symptoms • Six-minute walk tests • Quality-of-life measures and cost-effectiveness (core lab) • Echocardiography assessment of valve performance (core lab) • Peak and mean gradients • Effective orifice area • Bioprosthetic valve regurgitation (esp. para-valvular) • Other: LV ejection fraction, MR, LV mass, evidence of structural valve deterioration
Study Administration Quality of Life and Cost-Effectiveness Chairman: David J. CohenMid America Heart Institute, Kansas City Independent BiostatisticalCore Laboratory Stuart Pocock, Duolao WangLondon School of Hygiene andTropical Medicine William N. Anderson Publications Committee Co-Chairman: Jeffrey W. MosesLars G. Svensson Sponsor Edwards Lifesciences: Jodi J. Akin Co-Principal Investigators Martin B. Leon, Craig R. SmithColumbia University Medical Center Executive Committee Martin B. Leon, Michael Mack, D. Craig Miller, Jeffrey W. Moses,Craig R. Smith, Lars G. Svensson, E. Murat Tuzcu, John G. Webb Data & Safety Monitoring Board Chairman: Joseph P. CarrozzaTufts University School of Medicine Clinical Events Committee Chairman: John L. PetersenDuke University Medical Center Echo Core Laboratory Chairman: Pamela C. Douglas Duke University Medical Center
Executive Committee Lars Svensson Craig Miller Michael Mack Jeff Moses Murat Tuzcu Marty Leon John Webb Craig Smith
Univ. of WashingtonSeattle, WA Hospital Laval Quebec City, Canada Toronto Gen. Hospital Toronto, Canada Mayo Clinic Rochester, MN Brigham & Women’s Mass General Boston, MA Intermountain Medical Center Salt Lake City, UT Stanford University Palo Alto, CA Univ. of Penn Phila., PA Northwestern Univ. Chicago, IL Columbia University Cornell University New York, NY Cleveland Clinic Cleveland, OH Cedars-Sinai Medical Center Los Angeles, CA Washington Hosp. Center Wash., DC Univ. of Virginia Charlottesville, VA Scripps Clinic La Jolla, CA Emory University Atlanta, GA Medical City Dallas Dallas, TX Leipzig Heart Center Leipzig, Germany Ochsner Foundation New Orleans, LA Univ. of Miami Miami, FL Participating Study Sites St. Paul's Hospital Vancouver, Canada Evanston Hospital Barnes-Jewish HospitalSt. Louis, MO St. Luke’s Hospital Kansas City, MO n = 1,057 patients 26 investigator sites 22 USA, 3 Canada, 1 Germany
Study Devices Edwards SAPIEN THV 23 and 26 mm valves RetroFlex 22 and 24 F sheaths Ascendra 24 and 26 F sheaths
TAVR Transfemoral and Transapical Transapical Transfemoral
Inclusion Criteria • Severe AS: Echo-derived AVA < 0.8 cm2 (or AVA index < 0.5 cm2/m2) and mean AVG > 40 mm Hg or peak jet velocity > 4.0 m/s •Cardiac Symptoms: NYHA Functional Class ≥ II • High surgical risk: Predicted risk of operative mortality ≥ 15% (determined by site surgeon and cardiologist); guideline = STS score ≥ 10
Key Exclusion Criteria (1) Anatomic: • Bicuspid or non-calcified aortic valve • Aortic annulus diameter (echo measurement) < 18 mm or > 25 mm • Aortic dissection or iliac-femoral dimensions or diseaseprecluding safe sheath insertion (esp. calcification) • Severe LV dysfunction (LVEF < 20%) • Untreated CAD requiring revascularization • Severe AR or MR (> 3+) or prosthetic valve (any location)
Key Exclusion Criteria (2) Clinical: • Serum Cr > 3.0 mg/dL or dialysis dependent • Acute MI within 1 month • Upper GI bleed within 3 months • CVA or TIA within 6 months • Any cardiac procedure, other than BAV, within 1 month or within 6 months for DES • Hemodynamic instability (e.g. requiring inotropic support)
Statistical Analysis Plan • Primary hypothesis is non-inferiority of test (TAVR)vs. control (AVR) for all-cause mortality at 1 year • Non-inferior if one-sided 95% upper confidence limit forthe treatment difference is < 7.5% (α =0.05) • Primary Endpoint: All TF and TA patients • Assuming true 1-year mortality 32% after AVR and 29% after TAVR • Intended sample size = 650 patients for ≥ 85% power • Powered Secondary Endpoint: Only TF patients • Assuming true 1-year mortality 35% after AVR and 25% after TAVR • Intended sample size = 450 patients for ≥ 85% power
Study Methodology • Preliminary eligibility determined by site investigators • Every case reviewed by web-based conference callbefore enrollment • Randomized to TF-TAVR vs. AVR, or TA-TAVR vs. AVR, to be treated within 2 weeks • Intent-to-treat (ITT) analysis for the primary and most secondary endpoints; defined as the time of randomization • As-treated (AT) analysis for some procedural endpointsand for echo assessments; defined as thetime of procedural anesthesia induction
Study Flow Randomized = 699 patients Transfemoraln = 492 Transapicaln = 207 TF = 492 TA = 207 TAVR (244) AVR (248) TAVR (104) AVR (103) 30 Days (236) Dead = 8 Withdrawal = 0 30 Days (223) Dead = 15 Withdrawal = 10 30 Days (100) Dead = 4 Withdrawal = 0 30 Days (92) Dead = 7 Withdrawal = 4 1 Year (189) Dead = 46 Withdrawal = 1 1 Year (168) Dead = 47 Withdrawal = 8 1 Year (73) Dead = 26 Withdrawal = 0 LTFU = 1 1 Year (68) Dead = 20 Withdrawal = 3 LTFU = 1 42 Patients not treated as assigned
Reasons for Non-treatment ITT = 699 patients │ AT = 657 patients NOTE: Time from randomization to treatment = TAVR 10.6 [SEM 0.7] daysvs. AVR 15.6 [SEM 1.1] days; P <0.001
Patient Characteristics (1) 5.7 6.0 Cerebrovascular disease - %
Patient Characteristics (2) 0.94 43.0
Procedural Outcomes - TAVR vs AVR AVR TAVR 3 failed access 2 new TEE findings 2 died Aborted procedure - no. (%) *Converted to transapical TAVR due to porcelain aorta
Procedural Outcomes - TAVR vs AVR AVR TAVR 5 valve embolization 3 annulus size on TEE 1 large sigmoid septum 5 converted to AVR 2 valve-in-valve 2 not treated Converted to AVR - no. (%) Valve embolization - no. (%) *Converted to transapical TAVR due to porcelain aorta
Primary Endpoint:All-Cause Mortality at 1 Year • HR [95% CI] =0.93 [0.71, 1.22] • P (log rank) = 0.62 0.5 TAVR AVR 0.4 26.8 0.3 24.2 0.2 0.1 0 0 6 12 18 24 No. at Risk Months TAVR AVR
Primary Endpoint:All-Cause Mortality at 1 Year Difference -2.6% Upper 1-sided 95% CI 3.0% TAVR(N = 348) 24.2% AVR(N = 351) 26.8% Non-inferiorityP value = 0.001 Zone of non-inferiority pre-specified margin = 7.5% Non-inferior -2.0 -1.0 0.0 2.0 3.0 4.0 5.0 6.0 7.0 8.0 % -3.0 1.0 Upper one-sided 95% CI Primary Non-Inferiority Endpoint Met
All-Cause MortalityTransfemoral (N=492) • HR [95% CI] =0.83 [0.60, 1.15] • P (log rank) = 0.25 26.4 22.2 No. at Risk Months TAVR AVR
Powered Secondary Endpoint (ITT):TF All-Cause Mortality at 1 Year TAVR(N = 248) 22.2% AVR(N = 244) 26.4% Difference -4.2% Upper 1-sided 95% CI 2.3% Non-inferiorityP value = 0.002 Zone of non-inferiority pre-specified margin = 7.5% Non-inferior -4.0 -3.0 -2.0 -1.0 0.0 2.0 3.0 4.0 5.0 6.0 7.0 8.0 % -5.0 1.0 Upper one-sided 95% CI Secondary TF Non-Inferiority Endpoint Met
All-Cause MortalityTransapical (N=207) • HR [95% CI] =1.22 [0.75, 1.98] • P (log rank) = 0.41 29.0 27.9 No. at Risk Months TAVR AVR
Surgical AVR Outcomes • Using an established predictive risk model (STS), the expected (“E”) 30-day mortality after AVR was 11.8%. • The observed (“O”) 30-day mortality in the as-treated AVR control group was 8.0%. • O:E = 0.68 indicates better than predicted surgical outcomes in the control AVR patients. • There were no significant site or surgeon differences.
Clinical Outcomes at 30 Days and 1 Year All Patients (N=699) * Renal replacement therapy
Clinical Outcomes at 30 Days and 1 Year All Patients (N=699)
Neurological Events at 30 Days and 1 Year All Patients (N=699) p-value p-value
All-Cause Mortality or StrokeAll Patients (N=699) • HR [95% CI] =0.95 [0.73, 1.23] • P (log rank) = 0.70 28.0 26.5 No. at Risk Months TAVR AVR
NYHA Functional Class • P = 1.00 • P < 0.001 • P = 0.05 • P = 0.75 Patients Surviving, % Baseline 30 Days 6 Months 1 Year I II III IV
Six-Minute Walk TestAll Patients (N=699) • P = 0.73 • P = 0.002 • P = 0.33 • P = 0.76 Median Distance, meters
Subgroup Analyses of Treatment EffectAll-Cause Mortality at 1 Year 0.5 1 2 TAVR better AVR better
Subgroup Analyses of Treatment EffectAll-Cause Mortality at 1 Year 0.5 1 2 TAVR better AVR better
Echo FindingsAortic Valve Gradients 80 Peak Gradient - AVR 70 Peak Gradient - TAVR Mean Gradient - AVR Mean Gradient - TAVR 60 50 40 Mean and Peak GradientAs-Treated Trial Arms (mmHg) 30 20 10 0 Baseline 30 Days 6 Months 1 Year TAVRn = 327 TAVRn = 287 TAVRn = 246 TAVRn = 227 AVRn = 159 AVRn = 301 AVRn = 231 AVRn = 170
Echo FindingsHemodynamic Assessments p-value p-value
Paravalvular Aortic Regurgitation • P < 0.001 • P < 0.001 • P < 0.001 Patients, % 30 Days 6 Months 1 Year Severe None Trace Mild Moderate
Study Limitations • 8% of the control (AVR) group withdrew or refused assignedtherapy • 5% of patients randomized to TAVR did not receiveassigned therapy (procedure aborted or converted to AVR) • Significantly longer interval between randomization andtreatment in controls (AVR) • An early version large TAVR delivery system was used • Most sites had no previous TAVR experience - learningcurve impact inherent in TAVR, but not in AVR • Insufficient statistical power to compare TA to either AVRor TF • Long-term follow-up not available to assess TAVR durability
Conclusions (1) • The primary endpoint of the trial was met: • In patients with aortic stenosis at high risk for operation, TAVR was non-inferior to AVR for all-cause mortality at 1 year (24.2% vs. 26.8%, p=0.001 for non inferiority) • Transfemoral TAVR subgroup was also non-inferior toAVR (p=0.002 for non-inferiority) • Death at 30 days was lower than expected in botharms of the trial: • TAVR mortality (3.4%) was the lowest reported in any series, despite an early generation device and limited previous operator experience • AVR mortality (6.5%) was lower than the expected operative mortality (11.8%)
Conclusions (2) • Both TAVR and AVR were associated with important but different peri-procedural hazards: • Major strokes at 30 days (3.8 vs. 2.1%, p=0.20) and one year (5.1% vs. 2.4%, p=0.07) and major vascular complications were more frequent with TAVR (11.0% vs. 3.2%, p<0.001) • Major bleeding (9.3% vs. 19.5%, p<0.001) and new onset atrial fibrillation (8.6% vs. 16.0%, p<0.001) were more frequent with AVR • TAVR and AVR are both acceptable therapies in these high-risk patients; differing peri-procedural hazards should influence case-based decision-making