Download
1 / 25
250 likes | 405 Views
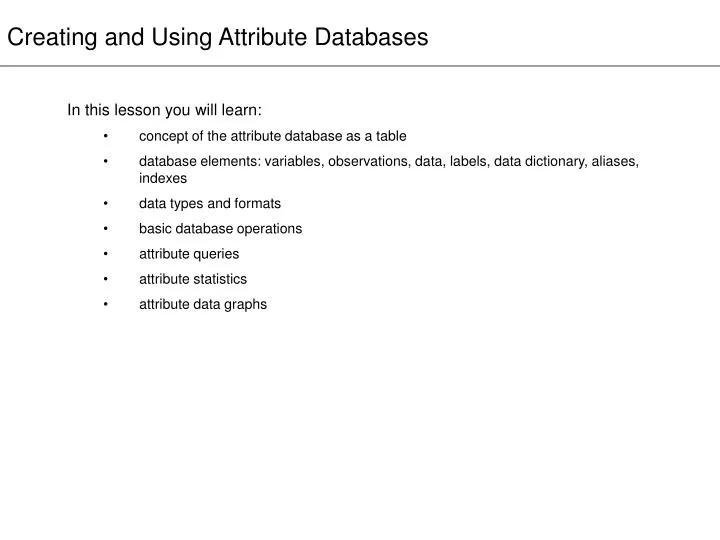
Creating and Using Attribute Databases. In this lesson you will learn: concept of the attribute database as a table database elements: variables, observations, data, labels, data dictionary, aliases, indexes data types and formats basic database operations attribute queries

E N D
Creating and Using Attribute Databases • In this lesson you will learn: • concept of the attribute database as a table • database elements: variables, observations, data, labels, data dictionary, aliases, indexes • data types and formats • basic database operations • attribute queries • attribute statistics • attribute data graphs
Database elements Portion of the data dictionary for the Illinois Historic Tornado database.
Creating the database • Steps in creating the attribute database • identify the attributes to be captured • create attribute columns for each attribute; label each column • specify the data type for each attribute • specify validation rules for each attribute • specify the data format for each attribute
Common database “exchange” formats Tabular database formats
Tabular database formats Comma-delimited text (filename.csv) Tab-delimited text (filename.txt) Fixed-width text (filename.txt)
Basic database operations Data maintenance • data entry & editing • sorts • queries • data statistics • data graphs Data segmentation Data verification
add/delete observations • add/delete attribute fields • edit data • spell check (text & memo fields) • find/replace • re-enter data • append new observations • restructure attribute data • calculate new field based on existing fields • modify format • change data type Basic database operations: data maintenance
Basic database operations: sorts Single-column sort Multi-column sort
ii ii Basic database operations: hierarchical sorts (1) (2) (3) Hierarchical sort: column 1 (ascending); column 2 (ascending); column 3 (descending)
residential transportation & utilities commercial parks & open space industrial Simple attribute queries Land-use percentage, by city ward
Compound attribute queries The contingency table view of compound attributes
“NOT Black” horses The set of horses ≥ 5 yrs old The set of Black horses The set of Black horses Operator Set action Logic Outcome NOT set complement Logical converse of the operand. AND intersection of two sets True if both operands are true, false otherwise. OR union of two sets True if either 1st or 2nd operand is true, or if both are true. False if both operands are false. XOR union less intersectionTrue if 1st operand is true or 2nd operand is true. False if both are true or both are false. Compound statements are written in the form: operand-1LOGICAL OPERATORoperand-2; i.e., horse = black AND horse = 5 years of age or older Multi-attribute queries The set of all horses
mean Measures of central tendency • Median: center point of a data distribution • exactly 50% of the observations have a data value < the median and 50% have a data value > the median • Mean: the average data value = 1/n × Σ (all data values) • the mean = the median only if the data are unimodal and symmetrically distributed about the mean
Measures of dispersion • Range: the span, or extent of data values • range = maximum data value – minimum data value • Variance: average squared distance of all observations from the mean • Standard Deviation: the square root of the variance, interpreted as the average distance of all observations away from the mean. • for a unimodal symmetric distribution, approximately 68% of all data values will lie within one standard deviation of the mean and 95.4% within 2 standard deviations of the mean
Data graphs for visualizing the distribution of data Box-whisker plot Quantile-Quantile plot, with Normal distribution reference line Density plot Histogram with density plot (Normal distribution)
Data graphs for visualizing data relations A bivariate scatterplot illustrating the relationship between soil Calcium and Cation Exchange Capacity in a northern Illinois soil.
In this lesson you learned: • Tabular databases are organized as tables, with rows as observations, columns as attributes, and the data or information contained inside the table. It may also contain indexes, a data dictionary, and aliases. • The data dictionary is vital to the proper interpretation and use of data. It should contain a description of each attribute’s measurement scale, how it was measured, when and where it was collected, by whom, and for what purpose. • Database design includes: which attributes and how they are labeled, what data type to use for each attribute, data validation rules, and data storage format. • Basic data types include text string or memo for text or qualitative information, and integer, decimal, and byte for numeric or quantitative information. • Tabular databases can be created in database, spreadsheet, statistical analysis and other software and exchanged in standard database, spreadsheet, ODBC, and formatted text file formats. • Nearly all database software has functional capabilities for data entry and editing, sorts, queries, data statistics, and data graphs. • Save a copy of your database before performing any maintenance or segmentation! Be especially careful with editing operations involving find/replace, and any operation that changes data formats or type. • Single- and multi-column sorts are useful for isolating more obvious data errors and as a starting point for segmenting the data into smaller databases, classifying observations, and creating indexes. • Query operations can take the form of find queries, filter queries or subset queries, of which only the last effects permanent change to the content of the database. • Compound queries utilize the logical operators NOT, AND, OR and XOR to join query operands. • Measures of central tendency, measures of dispersion, data distribution graphs, and scatterplots are often useful in data verification, but their greatest value is in data segmentation. What you have learned