Download
1 / 40
400 likes | 484 Views
US Amtrak Network. Major Josiah Pickett Captain Philip Zlatsin Lieutenant Brett Robblee. Background. Intermodal Surface Transportation Efficiency Act of 1991 (ITSEA) Demand for High-Speed Rail (HSR) in the US. Current Economy Emerging Market. Background.

E N D
US Amtrak Network Major Josiah Pickett Captain Philip Zlatsin Lieutenant Brett Robblee
Background • Intermodal Surface Transportation Efficiency Act of 1991 (ITSEA) • Demand for High-Speed Rail (HSR) in the US. • Current Economy • Emerging Market
Background • New vision for High-speed Passenger Rail throughout the US. • Federal Railroad Administration (FRA) launches the High-Speed Intercity Passenger Rail (HSIPR) Program • POTUS Goals
Objectives • Model the current network. • Determine a development plan based on budget (distance to improve) while minimizing the cumulative total time traveled.
Network Development • Current Network • Design Network
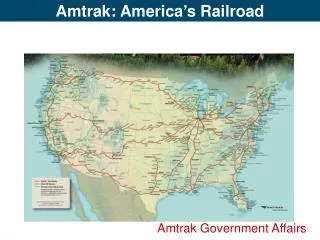
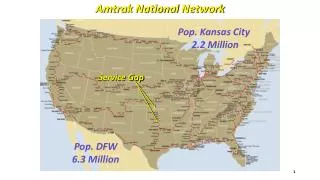
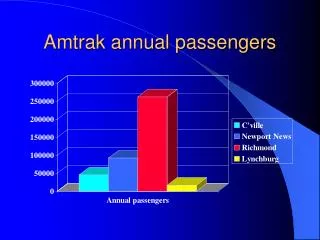
Input Data • Nodes: Stations with annual ridership • Edges: Existing rail lines between stations with distances.
Assumptions • People choose the shortest path. • No capacity issues.
Basic model New-York Chicago 50 hours 200 hours 300 hours Miami San-Francisco 300 hours
Basic model 1M go to NY 0.5M go to Miami 0.5M go to SF 1.5M come to Chicago (from other places) 2M want to Chicago 3M want to Miami 1M want to SF 5M come to NY (from other places) New-York Chicago 50 hours 200 hours 300 hours Miami San-Francisco 300 hours
Basic Model • Multi-commodity min-cost flow. • ci,j – time to get from station i to j. • yi,jk – amount of people from type k (final destination) that go between i and j • Objective function (MOP) – minimize the total amount of hours spent.
Basic model results • Preferred routes • Total amount of time spent on the train. But we are interested in the future!
Design model assumptions • Speed on the new rail is 150 mph • (75 mph on regular rail)[1] • New rails don’t change people’s behavior. • Every old rail can be improved to a fast one.
Design model Chicago’ 25 hours New-York’ Chicago New-York 50 hours 100 hours 200 hours Miami Miami’ Sum distance of new arcs < X
Design Model formulation • yi’,j’ k – flow on new rail between i and j. • xi’,j’– should we build new rail between i and j? • M – sufficiently large number
Results • Original Model: • Cumulative time riders spend per year on AMTRAK trains in our model sums to 44M hours, 5000 years.
600 Mile Budget Plus LA to Irvine, CA
81% 70% Bos. ->D.C. ; Chi.-> Mil.; Greater LA 64% Bos. -> Mil.; Greater LA 58.5% NYC -> D.C. • At 4000 miles, reduced to 58.5% of the of the original cumulative time. • Approximately 2900 years
At 10,000 miles, reduced to 52.4% of the of the original cumulative time. • Approximately 2600 years
Conclusions • Up to a budget of 4000 miles – resultsmatch! • 10,000 miles – results match with some differences. • Possible reasons: • Partial Model (10% of the nodes) • Different objective functions • Assumptions
Future Research • Better estimations: • Ridership • Per station • Between stations • Speed on different rails • New optional rails and stations • Will new rails change ridership? • Other objective functions: • Accessibility • Cost • Effect on enviroment • Nested design
Other Attempts • Less successful models: • Max flow vs Multi Commodity • Not weighting distances • Interdiction • New rails • Constraints on number of arcs (instead of mileage)
Bibliography • Government, U. (2008, 12, 15). High-Speed Rail Experience in the United States. http://www.amtrak.com/ccurl/16/785/Amtrak-High_Speed_Rail-A_National_Perspective.pdf. • Government, U. (2012, 11 03). High-Speed Intercity Passenger Rail Program. Retrieved 11 18, 2013, from Federal Railroad Administration: http://www.fra.dot.gov/rpd/passenger/2243.shtml • Nagasaki, H. (2012, 08 27). USA Rail Guide. Retrieved 11 18, 2012, from http://trainweb.org/usarail/index.html • Wiki. (2012, 11 18). AMTRAK. Retrieved 11 18, 2012, from Wikipedia: http://en.wikipedia.org/wiki/Amtrak • Wikipedia. (2012, 11 15). High-Speed Rail in the United States. Retrieved 11 18, 2012, from Wikipedia: http://en.wikipedia.org/wiki/High-speed_rail_in_the_United_States • Wikipedia. (2012, 11 5). List of suburban and commuter rail systems. Retrieved 11 19, 2012, from Wikipedia: http://en.wikipedia.org/wiki/List_of_suburban_and_commuter_rail_systems